

Three weeks before your seminar, Chapter Four comes back from your supervisor with a single note in red pen: "The test used is not appropriate for the nature of the data." Many master's and PhD researchers at Egyptian universities face this moment. The data took months to collect and the tables came out of SPSS, but the real questions are still open: is this the right test? And are the results written in a way that will convince the committee?
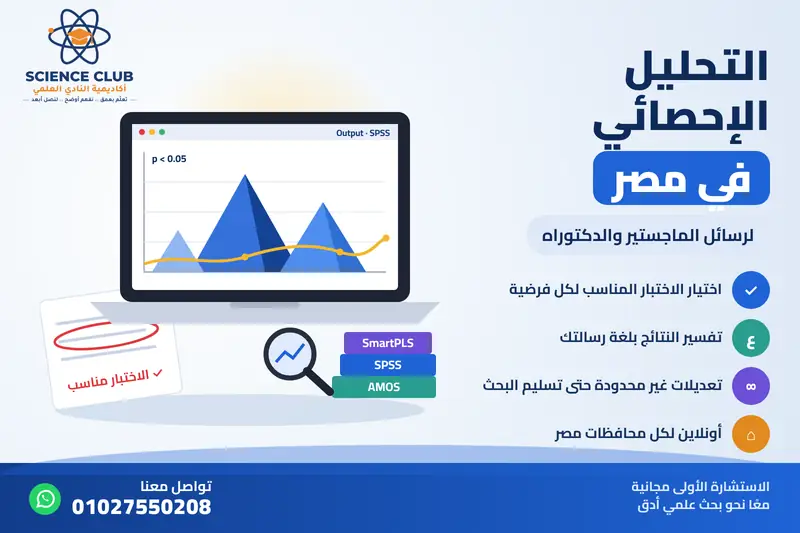
Science Club Academy provides online statistical analysis for researchers at Egyptian universities, from any governorate. Our team of specialist PhD holders receives your data, chooses the right statistical method for each hypothesis, and delivers the results written up and interpreted in the language of your thesis.
When Do You Need Statistical Analysis in Your Thesis?
Many researchers think statistical analysis only comes at the end, after data collection. In fact, statistics run through your thesis from beginning to end.
At the Proposal Stage
Before registering your proposal with the department, you need to determine the sample size and sampling method, and make sure your research instrument actually measures what you intend to measure. If your sample size is not based on a clear rationale, you may be asked about it at the seminar or the defense. We explain these methods in our article on how to determine sample size in scientific research, and the steps of writing the proposal in Preparing a Master's Research Plan.
After Data Collection
This is the core stage: coding and cleaning the data, testing validity and reliability, descriptive statistics, and then testing the hypotheses with the appropriate method.
After Feedback from Your Supervisor or Defense Committee
Your supervisor may ask for an additional test, object to a particular test, or ask for the tables to be presented differently. This is normal, and we treat it as part of the job: revisions are unlimited until your thesis is submitted.
Fields We Analyze and Their Most Common Tests
| Specialization | Typical data | Example tests |
|---|---|---|
| Education and Psychology | Scales, training programs, pre-test and post-test | Cronbach's alpha for reliability, paired-samples t-test, ANCOVA to compare experimental and control groups while controlling for the pre-test, Pearson correlation coefficient |
| Commerce and Business Administration | Models of relationships between latent variables | Confirmatory factor analysis in AMOS, structural equation modeling, bootstrapped mediation analysis in SmartPLS, HTMT for discriminant validity |
| Nursing, Medicine and Pharmacy | Group comparisons, risk factors, non-normally distributed data | Chi-square, Mann-Whitney, logistic regression and odds ratios |
| Social Work and Media Studies | Opinion and attitude surveys | Frequencies and percentages, chi-square, one-way ANOVA by demographic characteristics |
If your research is medical, read Statistical analysis for medical research.
Producing Tables vs. Interpreting Results
Any statistics program can produce a table, but a table alone does not answer your hypothesis. Look at this illustrative example:
Tables only:
t = 2.41, significance level Sig = 0.019.
The interpretation as we write it:
There are statistically significant differences at the 0.05 level between the mean scores of the experimental and control groups on the post-test, in favor of the experimental group; the first hypothesis is therefore accepted. The effect size indicates that the difference is not only statistically significant but also practically meaningful. This result is consistent with previous studies in the field and can be explained in light of…
The difference is that the interpretation links the number to the hypothesis, explains the direction and size of the difference, and sets up the discussion of the results in light of the theoretical framework. To learn more, see Interpreting the results of statistical analysis.
What You Receive from the Statistical Analysis Service
- Data coding and preparation: turning your questionnaire into an organized SPSS file and handling missing values and outliers.
- Choosing the right tests: based on your hypotheses, variable types and sample size. To understand the logic behind this choice, read our guide to choosing the right statistical test.
- Formatted tables: in the format your faculty or supervisor requires, ready for Chapter Four.
- Written interpretation of the results: in the language of your thesis, Arabic or English, linking each result to its hypothesis.
- The original output file: from the statistics program, in case your supervisor or the committee asks for it.
- Plagiarism check report: free of charge when the work is done by us.
An Example from Our Team's Work
A researcher needed to analyze their study model in SmartPLS. The team evaluated the measurement model (reliability and validity), assessed discriminant validity with the Fornell-Larcker and HTMT criteria, checked for multicollinearity, and then reported the structural model results. The team also added a CTA-PLS analysis to confirm the model type: an analysis that was not part of the original request, but that strengthens the researcher's position in front of the committee.
The Software We Use
We choose the software based on the nature of your research:
- SPSS: for core tests such as t-tests, ANOVA, correlation, regression and non-parametric tests.
- AMOS: for confirmatory factor analysis and structural equation modeling.
- SmartPLS: for complex models or relatively small samples.
- R: for analyses that need more flexibility.
If you are unsure which of these programs fits your study, we wrote a full comparison in The difference between SPSS, AMOS and SmartPLS.
How to Work with Us from Anywhere in Egypt
- Contact us via WhatsApp or our contact page, and send a summary of your thesis, your research instrument and your data.
- Free consultation: we review your data and hypotheses and recommend the right statistical method for each hypothesis.
- Price and timeline: set after reviewing your data.
- Analysis: carried out by a PhD specialist in your field.
- Checking the analysis before delivery:
- checking each test's assumptions before applying it, such as normality and homogeneity of variance, and using the non-parametric alternative when they are not met.
- matching every number in the tables against the original output file.
- making sure every hypothesis has a test, a result and an interpretation.
- Delivery: the tables, the interpretation and the output file.
- Revisions: unlimited until your thesis is submitted, and on request we can hold a discussion session to walk you through the results before your seminar or defense.
How Is the Price of Statistical Analysis Determined?
There is no fixed price, because every thesis is different. The price is set after reviewing your data and depends on:
- The size of the data and the number of variables.
- The number of hypotheses and tests required.
- The software used: analysis in AMOS or SmartPLS differs from core tests in SPSS.
- The timeline: urgent work costs more.
Mistakes We Often See in Master's Theses
A Mistake Explained: Using an Independent-Samples Test on Pre-Test and Post-Test Data
A researcher ran a training program with a single group of female students, measured their level before and after the program, and then compared the two using an independent-samples t-test. The problem is that both sets of scores come from the same people, so they are related, not independent. The correct test is the paired-samples t-test. Using the wrong test can change the significance level, and it is one of the first things a defense committee notices. (Illustrative example)
Other Common Mistakes
- Using a parametric test on data that are not normally distributed.
- Presenting results without linking them to the hypotheses.
- Reporting only the significance value (Sig) without the effect size or the direction of the differences.
- Pasting SPSS tables as they are, without formatting.
More details in our article Statistical Analysis Mistakes in Master's and PhD Theses.
Try the Free Statistical Lab
Test your questionnaire's reliability (Cronbach's alpha), run an item analysis and get descriptive statistics for your variables for free, with the results explained in Arabic and English.
Frequently Asked Questions
Do you work with students from all governorates in Egypt?
Yes. All the work is online, so it makes no difference whether you are in Cairo or any other governorate.
Can the Analysis Be Revised After the Supervisor’s Comments?
Yes, revisions are unlimited until the research is delivered.
Is the interpretation written in Arabic or English?
In the language of your thesis.
Do you provide a plagiarism check report?
Yes, free of charge when the analysis is done by us.
What if you cannot carry out what is required?
We refund your payment.
Can you explain the results to me before my defense?
Yes, we hold a results discussion session on request.
Before You Send Chapter Four to Your Supervisor
Send us your hypotheses and your data file as it is, even if it isn't tidy. In the free consultation we will tell you the right test for each hypothesis and whether your data meet its assumptions, before you commit to anything. And if you decide to go ahead, the team stays with you until your thesis is submitted.
Send us your data on WhatsApp now, or learn more about our Integrated statistical analysis service.

No comment