

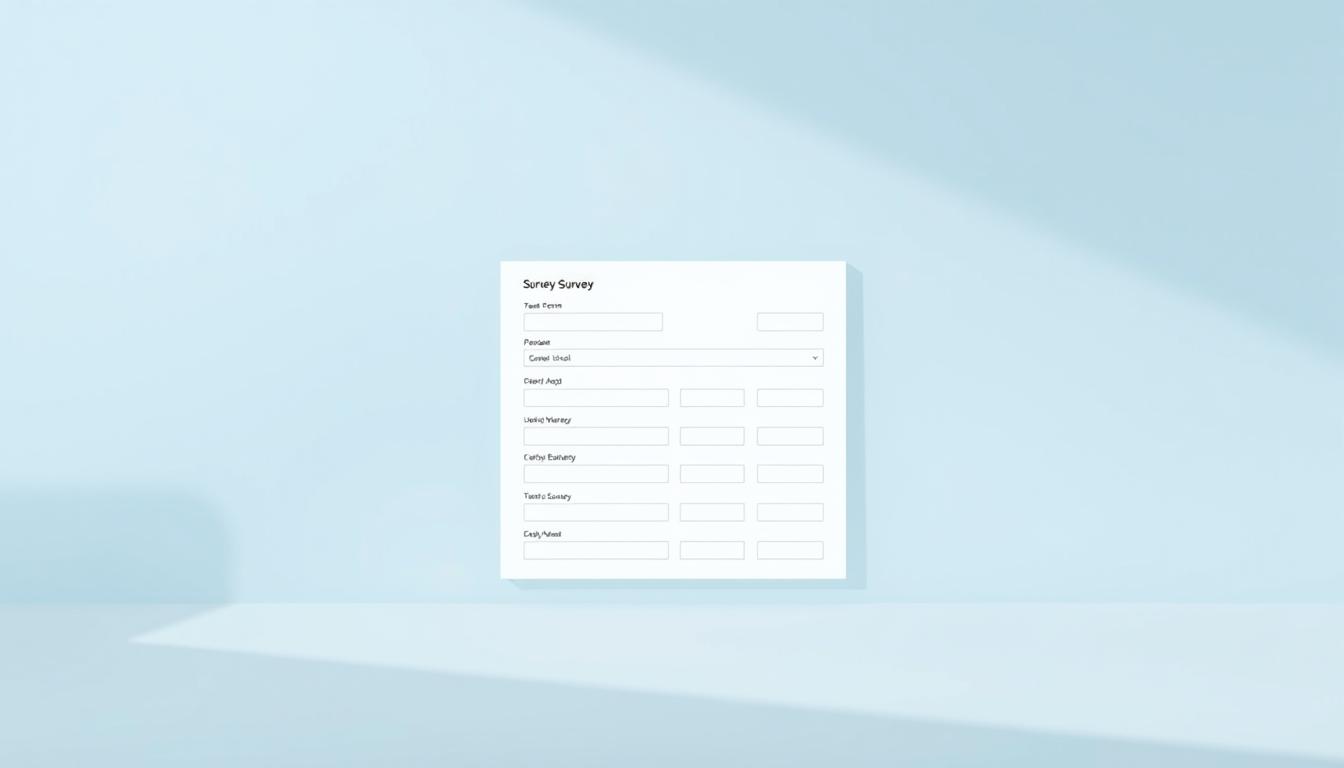
How to Create an Online Survey Step by Step with Google Forms
If you are asking how to create an online questionnaire for your research, the easiest way is Google Forms: it is free, supports Arabic, and automatically collects responses in a table ready for analysis. In this guide we explain how to create an online survey step by step, from creating the form to downloading the responses, including the step many researchers forget: testing the questionnaire's reliability before publishing.

Before You Open Google Forms
An online questionnaire is the same as your paper research questionnaire, only online, so prepare these things first:
- Dimensions and items: Each dimension measures one of your research variables, and it is best to take the items from published scales. For writing the items, see Questionnaire design and analysis.
- Demographic data: Include only what you will use in the analysis (gender, qualification, years of experience...).
- Scale: Choose a Likert scale (five-point or seven-point) and write its response options now.
- Sample: Know the required number of responses from the start, and see how to determine the sample size.
- Supervisor approval or expert review: Do not publish the questionnaire before its final version is approved, because any change after collecting responses corrupts the data.
How to Create an Online Survey with Google Forms Step by Step
1. Create a New Form
Go to forms.google.com with your Gmail account, then choose “Blank form”. From the theme icon (the color palette) you can choose the font and color or add your university's logo at the top of the form.
2. Title and Introduction
Write the study title, and in the description add a short introduction that includes: the study objective, the expected time to answer, that the data is confidential and used for scientific research only, and that participation is voluntary. Some universities require an explicit consent question at the start of the form (I agree to participate).
3. Choose the Type of Each Question
| Question in your questionnaire | Suitable type in Google Forms |
|---|---|
| Gender, qualification, age group | Multiple choice or dropdown |
| Likert scale items | Multiple choice grid (items as rows, response options as columns) |
| More than one possible answer | Checkboxes |
| Open opinion or suggestions | Paragraph |
| A number such as years of experience | Short answer with “Response validation” enabled to accept numbers only |
The advantage of the grid is that it shows all the items of a dimension in one table, like a paper questionnaire. On mobile it may look narrow, so if most of your sample will answer from their phones, make each item a separate “Multiple choice” question with the same response options.
4. Make Questions Required
Turn on “Required” under each essential question, and in the grid turn on “Require a response in each row”. This prevents missing values that cause problems in statistical analysis.
5. Divide the Questionnaire into Sections
Use “Add section” to put each dimension on its own page: a section for demographic data, then a section for each dimension. Short pages reduce fatigue and increase the completion rate.
6. Go to Section Based on Answer (Conditional Logic)
If some questions are only for a specific group, open the three-dot menu of a “Multiple choice” question and choose “Go to section based on answer”. Example: whoever answers “No” to the consent question goes straight to the end of the form, or whoever chooses “Manager” goes to questions for managers.
7. Important Settings
From the “Settings” tab:
- Limit to one response if you want to prevent duplicates (this requires participants to sign in with a Google account, which may reduce responses).
- Do not turn on email collection if you promised participants confidentiality.
- Write a thank-you note in the “Confirmation message”.
8. Preview and Publish
Click the preview icon (the eye) and try the questionnaire yourself on a computer and a phone. Then click “Send”, choose the link icon, turn on “Shorten URL”, and copy the link for distribution.
9. Receive and Download Responses
In the “Responses” tab you see a summary with charts, but for analysis click “Link to Sheets” to create a Google Sheets file, or download the responses as CSV. This is the file you open in SPSS or Excel. When the sample is complete, stop accepting responses from the same tab.
The best-known alternative is Microsoft Forms, which has very similar steps and suits you if your university gives you a Microsoft 365 account.

Before Publishing: Test Your Questionnaire's Reliability
First send the link to a small pilot sample from the same study population (usually around 30 participants, depending on what your supervisor requires), then download their responses and calculate:
- Cronbach's alpha for each dimension: A value of 0.70 or higher is acceptable in most studies.
- Correlation of each item with its dimension: An item with a weak or negative correlation is often unclear or reverse-worded.
You can calculate this for free by uploading the responses file to the free statistics lab, or in SPSS as shown in Reliability and validity testing in SPSS. Revise the weak items, and delete the pilot responses or create a new copy of the form before the final distribution.
Try the free Content Validity Lab
Enter the experts' ratings for the items of your instrument and calculate I-CVI, CVR and Aiken's V for each item, with a clear verdict and a ready methods paragraph in Arabic and English.
Try the Free Statistical Lab
Calculate your questionnaire’s reliability (Cronbach’s alpha), analyze the items, and get descriptive statistics and frequencies, with interpretation in Arabic and English.
Distributing the Questionnaire and Increasing Responses
- Send the link in groups of the study population itself (work, student or teacher groups), not in general groups, so the sample stays representative.
- Write a short accompanying message: who you are, the study objective, and the time required.
- Keep the answering time as short as possible, and send one reminder after a few days.
- Track the number of responses against the required sample size.
From Google Forms to Analysis
The responses file comes out as text (agree, neutral...), so you need to code it as numbers before analysis. The detailed steps are in Questionnaire Analysis Using SPSS Step by Step.
Need Help with Your Questionnaire?
The Science Club Academy team helps you design your online questionnaire, test its validity and reliability, then analyze the responses and interpret the results in the language of your thesis. The first consultation is free, and the price is set after reviewing your requirements. Learn about our Integrated statistical analysis service.
Frequently Asked Questions
How do I create an online questionnaire from my phone?
Open forms.google.com in your phone's browser and follow the same steps, although designing long questionnaires is easier on a computer.
What is the difference between closed, open and semi-structured questionnaires?
A closed questionnaire has predefined answers (such as a Likert scale) and suits statistical analysis, an open one lets participants write freely, and a semi-structured one combines both: closed questions with specific open questions. In Google Forms you use “Multiple choice” or “Grid” for closed questions and “Paragraph” for open ones.
Are online questionnaires accepted in master's theses?
Yes, in most universities, provided you explain in the methodology how it was distributed and how you ensured it reached the study population.
Can the questionnaire be edited after it is published?
Technically yes, but any change to the items after responses arrive makes the data inconsistent, so finish your edits before distribution.





No comment