The questionnaire as a cornerstone of contemporary scientific research
In the age of data and information, the Questionnaire The most common and effective research tool for collecting quantitative and qualitative data from a large sample of respondents. For researchers in Saudi Arabia, specifically in the city of Grandma In the UAE, mastering the art of Questionnaire design and analysis A critical skill that is indispensable for master's and doctoral theses and impactful applied research.
The challenge is not only to ask questions, but to formulate accurate and robust questions that lead to reliable and truthful data, and then the ability to Analyze this data statistically with advanced scientific methods. This comprehensive practical guide, provided by Science Club Academy, aims to provide researchers with the methodological steps and advanced techniques needed to ensure the quality of the questionnaire and the soundness of the Statistical analysis, which improves the chances of the research being accepted and published in reputable scientific journals. Section I: Methodological underpinnings of professional questionnaire design
Questionnaire design is the first and most important stage of the research process. Any flaws in this stage may lead to inaccurate results, thus undermining the credibility of the entire research. Professional design requires a combination of deep theoretical understanding of the variables under study and practical skill in formulating questions.
1. Defining objectives and variables: The methodological compass of the questionnaire
Before writing the first question, the researcher must be very clear about Research goals andHypotheses that it seeks to test. Each question in the questionnaire should serve a specific purpose and contribute to the measurement of a specific variable.
| Step | Description | Importance in scientific research |
| Determination of variables | Categorize variables into independent, dependent, mediating, and modifying. | It ensures that the questionnaire is measuring what it is supposed to measure (construct validity). |
| Determination of dimensions | Break down complex variables (such as job satisfaction) into sub-dimensions (such as work environment, incentives, relationships). | It makes it easier to formulate questions and ensures thorough coverage of the concept. |
| Formulation of hypotheses | Convert goals into statistically testable statements. | Guide the process of statistical analysis and selection of appropriate tests. |
Practical example: If the goal is to measure “the impact of e-training on job performance,” then “e-training” is the independent variable, and ”job performance” is the dependent variable. The survey questions should include items that clearly measure both of these variables.
Try the free Content Validity Lab
Enter the experts' ratings for the items of your instrument and calculate I-CVI, CVR and Aiken's V for each item, with a clear verdict and a ready methods paragraph in Arabic and English.
Open the Content Validity Lab
Try the Free Statistical Lab
Calculate your questionnaire’s reliability (Cronbach’s alpha), analyze the items, and get descriptive statistics and frequencies, with interpretation in Arabic and English.
Open the Free Lab
2. Formulation of questions: The art of precision and clarity
The wording of the questions is the core of the questionnaire. Questions should be clear, concise, unbiased, and appropriate to the level of understanding of the respondents.
A. Basic question types:
•Definition: Allows the respondent to choose from a predefined list of answers.
•Advantages: Ease of coding and statistical analysis, reducing the likelihood of errors.
•Examples: Yes/No questions, multiple choice questions, and rating scales (e.g. Likert scale).
•Definition: Allows the respondent to answer in their own words without restriction.
•Advantages: Provide rich qualitative data and discover unexpected insights.
•Disadvantages: Difficult to code and analyze, requiring more time and effort from the researcher.
B. Rating Scales: Likert Scale
Indeed, Likert Scale Most commonly used in social and managerial research. This scale measures the degree to which the respondent agrees or disagrees with a particular statement.
Number of points | Description | When is it used? |
Triple (3 points) | Agree, Neutral, Disagree. | When the goal is to get a clear and quick opinion. |
Quad (4 points) | Strongly Agree, Agree, Disagree, Strongly Disagree. | To avoid the “neutral” option and force the responder to take a position. |
Quintet (5 points) | Strongly Agree, Agree, Neutral, Disagree, Strongly Disagree. | The most common, it offers a balance between accuracy and ease. |
Heptathlon (7 points) | Provides higher accuracy in measuring subtle differences in trends. | In advanced research that requires high sensitivity in measurement. |
Professional advice: Make sure that all options in the scale are balanced (equal number of positive and negative options).
3. Validity and reliability: Ensuring the quality of the instrument (judging the questionnaire)
The results of any questionnaire cannot be relied upon unless its psychometric properties are ascertained: Validity andReliability.
A. Validity: Does the questionnaire measure what it is supposed to measure?
•Content Validity: This is ascertained by showing the questionnaire to a group of Arbitrators specialists (usually 5-10 experts) to ensure that the questions cover all aspects of the variable under study.
•Construct Validity: Measures the extent to which the survey questions are related to the theoretical construct of the variable. It is statistically tested using Factor Analysis.
•Criterion-Related Validity: Measures the extent to which the results of the questionnaire correlate with the results of another reliable instrument (probe).
B. Reliability: Are the results consistent and stable?
Reliability means that the questionnaire will give approximately the same results if applied to the same sample under similar conditions.
•Internal Consistency: is the most common, and is measured using the coefficient of Cronbach's Alpha. Cronbach's alpha should typically be 0.70 or higher to be considered reliable.
•Test-Retest: Apply the questionnaire twice to the same sample with a time interval, and calculate the correlation coefficient between the results.
The role of the academy: The academy provides a service Judging questionnaires By specialized professors, in addition to conducting all the necessary statistical tests of validity and reliability (factor analysis and Cronbach's alpha) to ensure the quality of the tool before the actual application.
Section II: Data collection: Moving from design to implementation
After finalizing the questionnaire design and ensuring its reliability and validity, the data collection phase comes next. This stage has undergone a radical transformation with the development of technology, especially in cities like Jeddah and Dubai that rely on modern technologies.
1. Sample selection: The basis for statistical generalization
The sample should be representative of the original population of the study to ensure that the results can be generalized.
Sample type | Description | When is it used? |
Simple random sample | The selection of individuals is completely randomized. | When society is homogeneous. |
Stratified sample | Divide the population into strata (e.g. gender, age, education level) and then select a random sample from each stratum. | When society is heterogeneous. |
Cluster sample | Divide the population into groups (clusters) and randomly select some of these clusters. | When the community is geographically large (suitable for a large city like Jeddah). |
2. Data collection methods: Balancing traditional and electronic
A. Paper-based (traditional) questionnaires:
•Advantages: Suitable for communities that are difficult to reach electronically, or when implemented in a single location (such as a classroom).
•Disadvantages: High cost, long collection and coding time, and increased likelihood of data entry errors.
b. Electronic (modern) questionnaires:
•Tools: Google Forms, SurveyMonkey, Qualtrics.
•Advantages: Super fast collection speed, low cost, automatic data coding, easy access to large samples in Saudi Arabia and the UAE.
•Disadvantages: It may not be suitable for the elderly or those who do not have good internet access.
Advice for researchers in Jeddah: Due to the high penetration of smartphones and the internet in Saudi Arabia, online surveys are preferred, with links to the survey sent via email or social media platforms to increase the response rate.
Section III: Advanced statistical analysis: Turning data into insights
The Statistical analysis This is the stage where raw numbers are transformed into meaningful results that support or reject research hypotheses. This section requires high expertise in using statistical programs and interpreting their outputs.
1. Data Cleaning and Preparation
Before starting the analysis, the data must be cleaned and prepared:
1.Coding: Convert text responses to numeric values (e.g. Strongly Agree = 5, Strongly Disagree = 1).
2.Handling Missing Data: Determine the cause of the missing data and use statistical methods to replace it (e.g., average or regression).
3.Discovering Outliers: Identify and process values that diverge significantly from the rest of the data.
4.Normality Test: Testing whether the data follows a normal distribution, a prerequisite for many parametric tests.
2. The most commonly used statistical programs: SPSS and AMOS
A. SPSS (Statistical Package for the Social Sciences):
•Use: most commonly used in social and humanities research.
•Descriptive statistics: Means, standard deviations, frequencies.
•Tests for differences: T-Test to compare two means, and analysis of one-to-one variance (ANOVA) to compare more than two means.
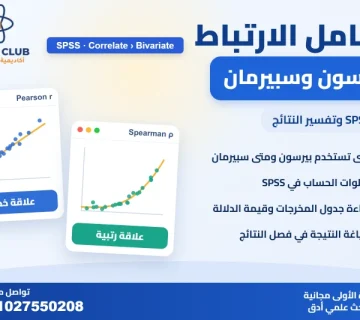
•Relationship tests: Pearson Correlation, simple and multiple linear regression.
B. AMOS (Analysis of Moment Structures) program:
•Use: Specializes in Structural Equation Modeling - SEM.
•Important: It is used to test complex relationships between variables, such as Causal Models and advanced construct validity testing (Confirmatory Factor Analysis - CFA).
•For advanced research: The use of AMOS is essential for doctoral dissertations and research involving complex theoretical models.
3. Testing statistical hypotheses: The heart of the analysis
The analysis process depends on choosing the appropriate statistical test for each hypothesis.
Hypothesis | Appropriate statistical test (using SPSS) | Objective |
The presence of a relationship | Correlation coefficient (Pearson/Spearman) | Measuring the strength and direction of the relationship between two variables. |
Differences between two groups | T-Test | Comparing the averages of two groups (e.g. males and females). |
Differences between more than two groups | One-way analysis of variance (ANOVA) | Compare the averages of three or more groups (such as income levels). |
Prediction | Multiple Linear Regression | Identify the independent variables that contribute to predicting the dependent variable. |
Testing a complex causal model | Structural Equation Modeling (SEM) - AMOS | Test the fit of the theoretical model to the data. |
Interpretation of results: The most important step is to interpret the value of Statistical Significance (P-value). If the P value is less than the adopted significance level (usually 0.05), we We reject the null hypothesis We accept the alternative hypothesis, meaning the result is statistically significant.
Fourth section: Science Club Academy: A Partner for Researchers in Jeddah and the UAE
The complexity of the questionnaire design and statistical analysis phases often requires the help of specialized experts. This is where Science Club Academy As a leading provider of Statistical Analysis Services and academic support for researchers in Grandma and Saudi Arabia, as well as in Emirates and the Gulf States.
1. Questionnaire design and arbitration services:
•Design a questionnaire from scratch: Building an integrated questionnaire that complies with the research objectives and methodology.
•Judging the questionnaire: The questionnaire was reviewed by specialized professors to ensure content validity.
•Confirmatory Factor Analysis (CFA): Use the AMOS program to test the construct validity of an instrument, a prerequisite for advanced research.
2. Advanced statistical analysis services:
•SPSS analysis: Perform all types of descriptive and inferential analyses (T-Test, ANOVA, Regression) with great precision.
•Analyze AMOS: Build and test complex structural models (SEM) and interpret their outputs in detail.
•Interpret and discuss the results: The academy's role is not limited to providing statistical tables. Interpretation of results And linking it to the theoretical framework and previous studies, which makes it easier for the researcher to write the discussion chapter.
“At Science Club Academy, we believe that research quality starts with the quality of the instrument. That is why we offer comprehensive support that helps researchers in Jeddah and the UAE obtain reliable data and accurate statistical analysis.”
Section V: Advanced Topics in Statistical Analysis: Structural Equation Modeling (SEM)
In this section, we go deeper into the more advanced aspects of statistical analysis that distinguish advanced research.
1. The concept of structural equation modeling (SEM)
Structural equation modeling is a set of multivariate statistical techniques that allow a researcher to test a set of interrelationships between observed variables and latent (unobserved) variables.
A. Latent Variables:
These are variables that cannot be measured directly (e.g. intelligence, job satisfaction, service quality). They are measured indirectly through a set of observational questions in the questionnaire.
B. Components of the SEM model:
1.Measurement Model: Determines how latent variables are measured by observed variables (survey questions). It is tested using Confirmatory Factor Analysis (CFA).
2.Structural Model: Identifies hypothesized causal relationships between latent variables.
2. Model Fit Indices
When using the AMOS program, the researcher must provide a set of indicators that prove that the theoretical model tested matches well with the data collected.
Indicator | Acceptable value (standard) | Description |
Chi-Square / df | Less than 3 (preferably less than 2) | Measures the contrast between the observed and estimated contrast matrix. |
CFI (Comparative Fit Index) | 0.90 or higher (preferably 0.95 or higher) | It compares the proposed model to the zero-based model. |
TLI (Tucker-Lewis Index) | 0.90 or higher (preferably 0.95 or higher) | An index similar to CFI, which penalizes more complex models. |
RMSEA (Root Mean Square Error of Approximation) | 0.08 or less (preferably 0.05 or less) | Measures how bad the match is for each degree of freedom. |
Academic advice: Mastering the interpretation of these indicators is what characterizes a professional researcher and is one of the core services provided by Science Club Academy For graduate students.
Section VI: Questionnaire Challenges in the Gulf Context and How to Address Them
Researchers at Grandma andEmirates Unique challenges that require innovative methodological solutions.
1. The challenge of access to the sample:
•Problem: Difficulty in reaching representative samples due to large population diversity and privacy.
•Solution: Use multiple data collection strategies (online/offline), with the help of specialists in designing and distributing online questionnaires.
2. The challenge of language and culture:
•Problem: The need to translate foreign questionnaires into Arabic while maintaining Cultural Validity.
•Solution: Using a technique Back-TranslationThe questionnaire is translated from English to Arabic, then translated back into English by another translator, and the two versions are compared to ensure equivalence.
3. Challenging technology:
•Problem: The need to use the latest statistical software (SPSS, AMOS), which requires specialized training.
•Solution: Take advantage of Specialized Training Courses andStatistical Analysis Services offered by the Academy, to handle data accurately and professionally.
The journey of designing and analyzing a questionnaire is a delicate methodological journey that requires patience, rigor, and statistical expertise. This practical guide has provided a comprehensive roadmap for researchers in Grandma and the region, from formulating the first question to interpreting the modeling outputs with structural equations.
To turn this theoretical knowledge into a successful practical application, you need a reliable academic partner. Science Club Academy provides integrated support at every stage of research: from Design of questionnaires andArbitrationto Advanced statistical analysis Using SPSS andAMOSand introducing Comprehensive interpretation of the results.
Don't let the complexities of statistics hinder your academic progress.
•[1] Drasah. (2025). 5 steps to designing an effective questionnaire for data collection.
•[2] Maktabtk. (2022). How do you set up a questionnaire in scientific research?
•[3] Science Club Academy. (n.d.). Statistical Analysis Services.






No comment