

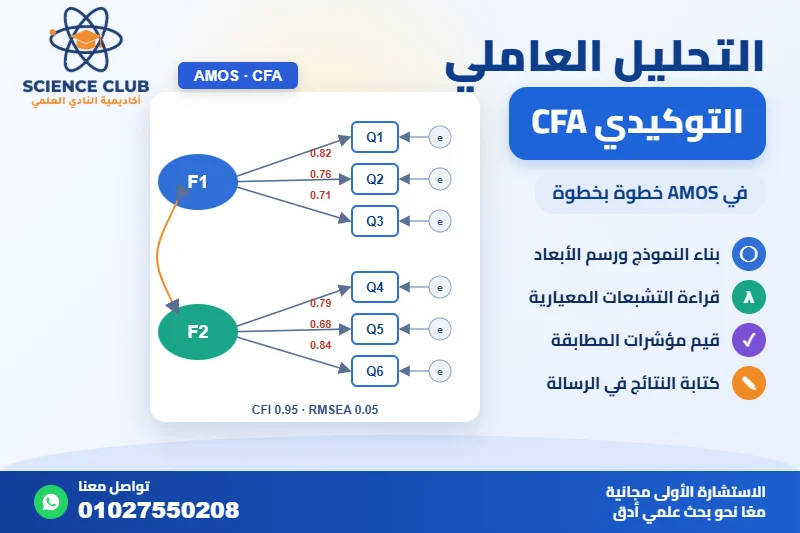
If your study uses a published scale or a questionnaire with predefined dimensions, the examining committee will most likely ask you to prove that these dimensions really exist in your data. This is exactly what confirmatory factor analysis (CFA) does. In this guide we explain how to build the model in AMOS, how to read the output, what values are acceptable for each index, and how to write the results in your thesis.
The difference between exploratory and confirmatory factor analysis
- Exploratory (EFA): used when you do not know the number of dimensions in advance, so the data reveal how the items group together. It is usually run in SPSS.
- Confirmatory (CFA): used when you specify in advance, based on theory or the original scale, which item belongs to which dimension, and then test whether the data support this structure. It is run in AMOS or other structural equation modeling software.
Simply put: exploratory analysis asks “what are the dimensions?”, while confirmatory analysis asks “are the dimensions I assumed correct?”. If you are unsure which software to use, see The difference between SPSS, AMOS and SmartPLS.
Before you start: preparing the data
- Sample size: CFA needs an adequate sample, depending on the number of items and dimensions. With a small sample the results are less reliable, and many references recommend at least about 200 respondents.
- Missing values: handle them before the analysis, because AMOS does not show modification indices when the file contains missing values.
- Variable names: use short English names in the SPSS file (such as Q1 and Q2), because the model reads the data directly from this file.
- Initial reliability: it helps to calculate Cronbach’s alpha for each dimension first, so you can spot any problematic item early.
Building the model in AMOS
- Open AMOS Graphics, then from File → Data Files choose your data file.
- Use the Draw a latent variable or add an indicator tool to draw the first dimension (the oval), then click inside it once for each item; AMOS draws the item boxes and their error terms.
- From List variables in data set , drag each item into its box.
- Name each dimension by double-clicking it, and name all error terms at once from Plugins → Name Unobserved Variables.
- Repeat for the other dimensions, then draw double-headed arrows between the dimensions to let them correlate.
- From View → Analysis Properties → Output , tick Standardized estimates andModification indices.
- Click Calculate estimates to run the analysis, then view the results in View Text.
Note: AMOS automatically fixes the loading of one item in each dimension to 1. This is required to identify the model and is not an error.
Reading the factor loadings
The first thing to check is the standardized loadings (Standardized Regression Weights):
- A loading of 0.70 or higher is good.
- A loading between 0.50 and 0.70 is acceptable in most studies.
- A loading below 0.50 makes the item a candidate for removal, but only remove it after making sure this does not damage the content of the dimension.
Also check that all loadings are statistically significant in the Regression Weights table (P below 0.05; AMOS shows *** when it is below 0.001).
Model fit indices and their acceptable values
Fit indices tell you whether the model you drew agrees with the data overall. These are the most common ones and the usual cut-offs in the literature (e.g., Hu and Bentler, 1999):
| Indicator | What it means | Acceptable value |
|---|---|---|
| CMIN/DF | Chi-square divided by degrees of freedom | Below 3 is good; up to 5 is acceptable for some researchers |
| CFI | Comparative fit index | 0.95 or higher is good; 0.90 or higher is acceptable |
| TLI | Tucker-Lewis index | 0.95 or higher is good; 0.90 or higher is acceptable |
| RMSEA | Root mean square error of approximation | 0.06 or lower is good; up to 0.08 is acceptable |
| SRMR | Standardized root mean square residual | 0.08 or lower |
Chi-square on its own is usually significant with large samples, so the model should not be judged by it alone. SRMR appears from Plugins → Standardized RMR if you keep its window open and run the analysis again.
Convergent validity and composite reliability
After model fit, many committees ask for two more indicators calculated from the standardized loadings:
- Average variance extracted (AVE): preferably 0.50 or higher for each dimension; it is the evidence of convergent validity.
- Composite reliability (CR): preferably 0.70 or higher.
AMOS does not calculate them directly, so they are computed from the loadings in Excel or with special plugins. To understand the difference between convergent and discriminant validity with examples, see our guide todiscriminant validity in SmartPLS; the principle is the same.
What to do if model fit is poor
- Check low loadings: an item with a very weak loading weakens the whole model.
- Use modification indices carefully: they suggest correlating some measurement errors. This is usually acceptable only between two errors within the same dimension, and with a logical reason such as similar wording of the two items.
- Make one change at a time: after each change, run the analysis again and review the indices, and report every change in your thesis.
- Do not modify just to improve the numbers: changes without a theoretical reason are the first thing the committee will ask about.
How to write the results in your thesis
A short example (the numbers are for illustration only):
Confirmatory factor analysis was conducted in AMOS to verify the factor structure of the three-dimension scale. The results showed an acceptable model fit (CMIN/DF = 2.31, CFI = 0.94, TLI = 0.93, RMSEA = 0.065, SRMR = 0.051), and the standardized loadings ranged from 0.61 to 0.84, all significant at the 0.001 level.
Then add a table of the loadings with the AVE and CR values for each dimension, and the AMOS model diagram with standardized estimates. For more on writing up results, see our guide to interpreting statistical analysis results.
Try the free SmartPLS & AMOS model diagnostic lab
Enter your model results exactly as your software reports them and see which indicators are acceptable and which need attention: loadings, AVE, CR, HTMT, Fornell–Larcker and fit indices, with a short measurement-model paragraph in English and Arabic.
Frequently Asked Questions
Do I need exploratory factor analysis before confirmatory?
Not always. If the scale is published and tested with defined dimensions, CFA alone is usually enough. If you developed a new scale, it is better to start with EFA.
Must all indices meet the cut-offs?
Most researchers look at the indices together, and a model is not rejected because one index is close to its cut-off, as long as you mention and justify it.
Can CFA be run in SPSS?
No. SPSS only runs exploratory factor analysis. For CFA you need AMOS or similar software.
Do you need help analyzing your research data?
The Science Club Academy team helps you prepare your data, analyze it, and interpret the results for master’s theses, doctoral dissertations, and research papers. Learn more about our Integrated statistical analysis service, and the consultation is free.







No comment