

خدمة التحليل الإحصائي للرسائل العلمية: طريقك نحو نتائج دقيقة وموثوقة
Why is statistical analysis the backbone of scientific research and smart decisions?
In the age of Big Data, making decisions or proving scientific hypotheses no longer relies on guesswork. There is an urgent need for خدمة التحليل الإحصائي للرسائل العلميةwhich is a cornerstone for academic researchers (in master's and doctoral theses) and for companies seeking to understand their market and customers.
Whether you are a university student struggling with questionnaires or a researcher looking to publish your paper in peer-reviewed journals, understanding how statistical analysis works and enlisting the help of specialists will save you a lot of time and effort, and ensure that your results are free of methodological errors.
What is statistical analysis (concept and importance)?
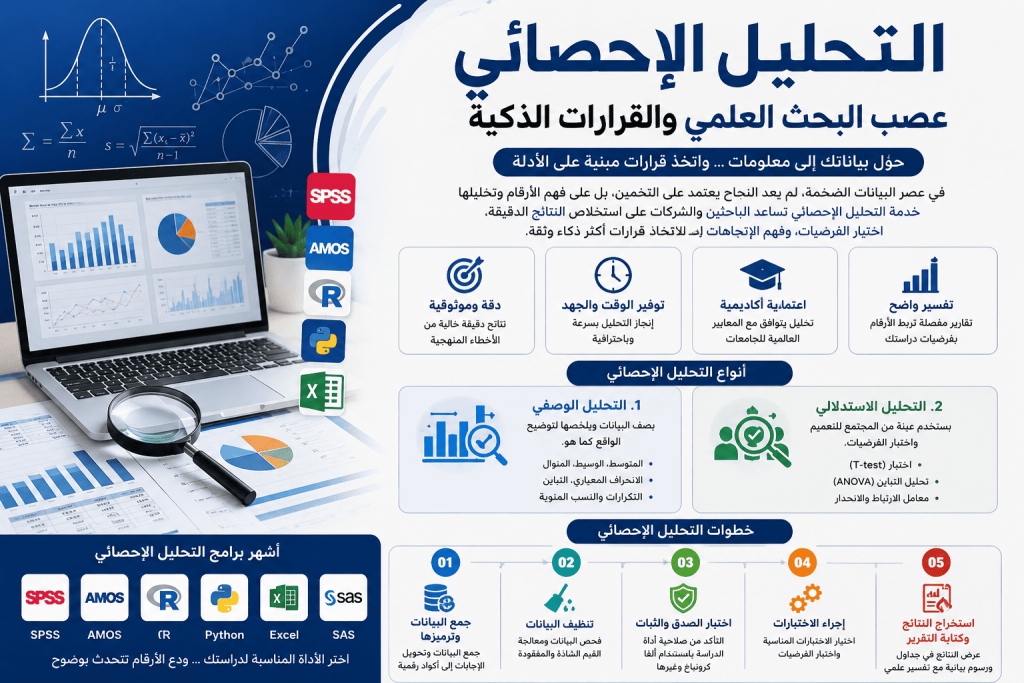
Statistical analysis is a science concerned with collecting, organizing, and exploring data, and then extracting patterns and trends from it to reach logical conclusions that support decision-making or validate scientific hypotheses.
فوائد الاستعانة بخدمة التحليل الإحصائي للرسائل العلمية
-
Accuracy and reliability: Avoid common data entry errors that can completely ruin your search results.
-
Saving time: Instead of spending weeks learning complex programs, a statistician gets the job done in record time.
-
Academic accreditation: Ensuring the acceptance of theses and dissertations through the use of statistical tests that comply with international university standards.
-
Interpret the results clearly: A statistical analyst doesn't hand you blind numbers, but a detailed report that connects the numbers to the hypotheses of your study.
The most popular statistical analysis programs used
There are many tools and programs, and they vary depending on the size of the data and type of study. Here's a quick comparison of the most prominent ones:
| Program name | Basic use | Level of difficulty | Target group |
| SPSS | Survey data analysis and social science | Average | Researchers and graduate students |
| R/Python | Dealing with big data and complex models | Advanced (requires programming) | Advanced Data Scientists and Analysts |
| Excel | Simple descriptive and graphical analytics | Easy | Startups and small businesses |
| AMOS | Structural equation modeling (SEM) | Advanced | Complex research that measures multiple relationships |
| SAS | Medical Analytics and Biometrics | Advanced | Health sector and large corporations |
Types of statistical analysis
Statistical analysis is mainly divided into two complementary parts that are indispensable to any rigorous study:
1. Descriptive Statistics
This type aims to summarize and describe the data collected in a simple way. It does not make out-of-sample conclusions, but merely presents the reality as it is used:
-
Measures of centralization: Arithmetic mean, median, mode.
-
Dispersion scales: Standard deviation, variance, range.
-
Frequencies and percentages.
2. Inferential Statistics
This is the deepest level where we use a sample of the population to generalize the results to the entire population. This is where we test hypotheses and examine relationships and correlations using tests such as:
-
T-test.
-
Analysis of variance (ANOVA).
-
Pearson or Spearman's correlation coefficient.
-
Linear Regression.
كيف يتم إجراء خدمة التحليل الإحصائي للرسائل العلمية؟ (خطوات العمل)
The process isn't just entering numbers into a program and extracting results, it's a systematic continuum. Here are the steps to carry out the analysis professionally:
The role of statistical analysis in improving the quality of scientific research and making accurate decisions
Statistical analysis is more than just crunching numbers and extracting tables; it is a strategic tool that helps researchers and organizations make decisions based on clear and reliable evidence. In scientific research, statistical analysis is used to determine the strength of the relationship between variables, measure the impact of different factors, and test scientific hypotheses with high methodological accuracy. For example, if a researcher wants to know the effect of a particular teaching method on student achievement, statistical analysis is the tool that reveals whether the results are real or just a random coincidence. In the business world, companies use statistical analysis to understand customer behavior, analyze consumer satisfaction, measure the effectiveness of marketing campaigns, and predict future trends, making statistical analysis an indispensable tool for anyone seeking to make smart decisions based on accurate data.
Common errors in statistical analysis that may lead to misleading results
رغم أهمية التحليل الإحصائي، إلا أن ارتكاب أخطاء بسيطة أثناء تنفيذ التحليل قد يؤدي إلى نتائج خاطئة تؤثر بشكل مباشر على مصداقية الدراسة أو القرار النهائي.
من أكثر الأخطاء شيوعاً اختيار اختبار إحصائي غير مناسب لطبيعة البيانات، مثل استخدام اختبارات البيانات الطبيعية على بيانات لا تتبع التوزيع الطبيعي، أو تجاهل القيم الشاذة (Outliers) التي قد تشوه النتائج النهائية.
كذلك، فإن إدخال البيانات بشكل غير صحيح أو وجود قيم مفقودة دون معالجة علمية مناسبة قد يؤدي إلى استنتاجات غير دقيقة.
ومن الأخطاء أيضاً تفسير النتائج بشكل خاطئ، مثل الاعتقاد أن وجود علاقة ارتباط يعني بالضرورة وجود علاقة سببية.
لهذا السبب، فإن الاستعانة بخبير متخصص في التحليل الإحصائي باستخدام برامج مثل SPSS أو AMOS أو R يضمن لك تنفيذ التحليل بطريقة علمية صحيحة، مع تفسير النتائج بشكل احترافي يتوافق مع المعايير الأكاديمية والبحثية الحديثة.
معايير اختيار أفضل مكتب أو خدمة التحليل الإحصائي للرسائل العلمية
Given the importance of this step in your scientific or professional career, you shouldn't leave your data in the hands of amateurs. When looking for a statistical analysis service, make sure they meet these criteria:
-
Academic experience: The analyst must be well versed in scientific research methods, not just computer programs.
-
complete confidentiality: Ensure that your data is not leaked or shared with third parties.
-
Support and review: Provide explanations of the results and be ready to make any adjustments that may be requested by the academic supervisor or the discussion committee.
-
Punctuality: Time is a critical factor for researchers, and delays in receiving results may delay graduation or decision-making.
الأسئلة الشائعة حول خدمة التحليل الإحصائي للرسائل العلمية (FAQs)
To make this article comprehensive and top Google Featured Snippets, we answered the most important questions from searchers:
1. How long does it take to perform statistical analysis for a master's thesis?
It depends on the sample size and the complexity of the hypotheses, but on average it takes 3 to 7 working days if the task is outsourced to a professional.
2. Is statistical analysis limited to the SPSS program only?
No, SPSS is the most popular in the humanities and social sciences, but there are researches that require other software such as AMOS for modeling, or R for big data. The program is determined based on the research requirements.
3. What should I do if the statistical results contradict my hypotheses?
This is normal in scientific research. A professional statistical analyst will explain the reasons for this difference with a clear scientific methodology; rejecting or accepting the null hypothesis is still a scientific result in itself.
4. Do I need to understand mathematical statistics to use the service?
Not necessarily. The role of the service provider is to simplify these numbers and turn them into an understandable scientific narrative that you can discuss and defend in front of the jury with confidence.

No comment