We use Advanced statistical analysis To help researchers and graduate students understand their data with high accuracy. We rely on professional software such as SPSS, AMOS, SmartPLS, and R to select appropriate tests, build statistical models, and prepare tables and graphs. We provide clear explanations of the results to ensure the strength and academic quality of the research.

Statistical analysis services for master's and doctoral theses

Statistical analysis tools and software we work with

What does advanced statistical analysis include?

Main article image 1200x500

Interpreting the results of statistical analysis: A Simplified Guide for Researchers in Riyadh Scientific Club Academy 01027550208

From deafening numbers to critical research decisions

At the heart of all good scientific research is the Statistical analysis. It is the moment when raw data, collected with effort and care, is transformed into meaningful stories and answers to study questions. However, many researchers, especially graduate students in Riyadh, Saudi Arabia, and the UAE, face a major challenge that is as important as the analysis process itself: Interpretation of statistical results.
Reading the output of SPSS, R, or Stata is not just a technical process, but an art that requires a deep understanding of statistical concepts and relating them to the context of the research issue. Statistical significance alone is not enough; it must be translated into Practical indication Serves the ultimate goal of the research.
Science Club AcademyAs a key pillar in supporting scientific research in the region, we offer this comprehensive and streamlined guide. Our goal is to equip researchers with the necessary cognitive tools to move beyond the “what do the numbers say?” phase to the “what do these numbers mean for my research?” phase. to "What do these numbers mean for my research?" In this article, we will review key concepts, methodological steps for interpreting results, and dive into the most popular statistical tests, with a focus on practices that ensure Search quality وCompliance with publishing standards universality.
Whether you are a novice researcher or a PhD student preparing to defend your dissertation, mastering the art of interpreting results is your key toSearch Engine Optimizationand enrich your research library with an original contribution. For specialized and reliable statistical support, you can contact us directly at 01027550208.

Section I: Statistical basics to know before interpreting

Before diving into complex output tables, a researcher must establish an understanding of three pivotal statistical concepts that form the cornerstone of the interpretation process.

1. Statistical hypotheses: Null and alternative

Every inferential statistical analysis begins with two mutually exclusive hypotheses:
Null Hypothesis (Null Hypothesis - H0): It assumes that there is no relationship, no difference, or no effect between variables. It is the starting point that the researcher is trying to disprove.
Alternative Hypothesis (Alternative Hypothesis - Ha): It assumes the existence of a relationship, difference, or effect. It is the hypothesis that the researcher seeks to prove.
The task of the interpreter: Statistical analysis does not “prove” the alternative hypothesis, but rather determines whether there is sufficient evidence to reject the null hypothesis.

2. Significance Level (Significance Level - α)

The significance level, or allowable error level, is defined as Alpha (α). It represents the maximum probability of rejecting the null hypothesis when it is true (Type I error).
Common value: In most social and educational research, α is defined at 0.05 (i.e., 5%).
Meaning: If α = 0.05, it means that the researcher is willing to accept the 5% error rate in their decision to reject the null hypothesis.

3. P-value

is the star in the output of statistical analysis. the P-value This is the probability we get from the analysis, representing the likelihood of getting the observed results (or more extreme results) if the null hypothesis is indeed true.
Statistical decision rule:
Status
Statistical decision
Practical interpretation
P-value < α (0.05)
We reject the null hypothesis
There is statistical significance. There is a difference/relationship/effect.
P-value ≥ α (0.05)
We do not reject the null hypothesis
No statistical significance. No difference/relationship/effect.
Applied example: If the P-value of the t-test is 0.001, which is less than 0.05, we reject the null hypothesis and conclude that there is a statistically significant difference between the two groups.

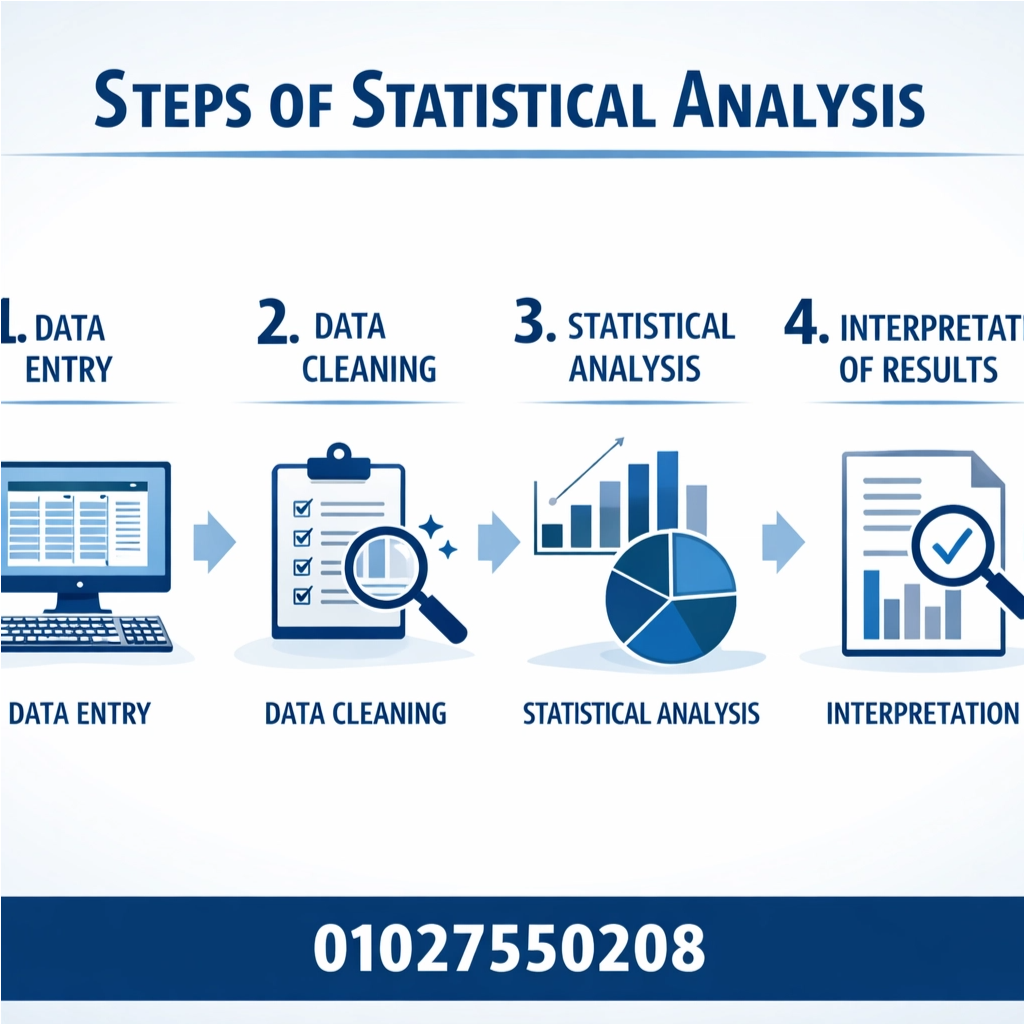
Section II: Step-by-step results interpretation journey

Interpreting results is a systematic process that requires rigor and a connection between numbers and theory.

Step 1: Understanding the output of the statistical program

Before you start interpreting, you should know how to read the statistical tables that the program generates.
Descriptive Tables: It contains means, standard deviations, frequencies, and percentages.
Test Tables: It contains the test value (such as t or F), degrees of freedom (df), and significance value (Sig. or P-value).

Step 2: Interpreting Descriptive Statistics

Descriptive statistics are the first to be interpreted, as they paint a clear picture of the data before moving on to inference.
1.Means: Indicates the central value of the variable. Its interpretation is to describe the level of the phenomenon (high, medium, low) based on the Likert scale used.
2.Standard Deviation: Indicates how dispersed the data is around the mean. The smaller the standard deviation, the more homogeneous the data, and vice versa.
3.Frequencies and Percentages: Used to describe categorical variables (e.g. gender, education level). Interpreted by identifying the most frequent and least frequent category.

Step 3: Interpreting Inferential Statistics

Here the hypotheses are tested and a statistical decision is made based on the P-value.
1.Test Statistic: Like the t value in a t-test, or the F value in an analysis of variance. This value is the basis for statistical judgment.
2.Degrees of Freedom (degrees of freedom - df): An important value for determining the probability distribution, depending on the sample size and the number of groups.
3.P-value: As mentioned earlier, it is the key to the decision.

Step 4: Relating the results to the theoretical framework

This is the most important step. The researcher must relate the statistical results to Theoretical Framework for the study and previous studies.
Comparison: Are the results consistent with previous studies?
Explanation: If the results are different, what are the possible reasons (different sample, cultural context, tools used).
Recommendations: Based on the interpretation, what practical and scientific recommendations can be made?

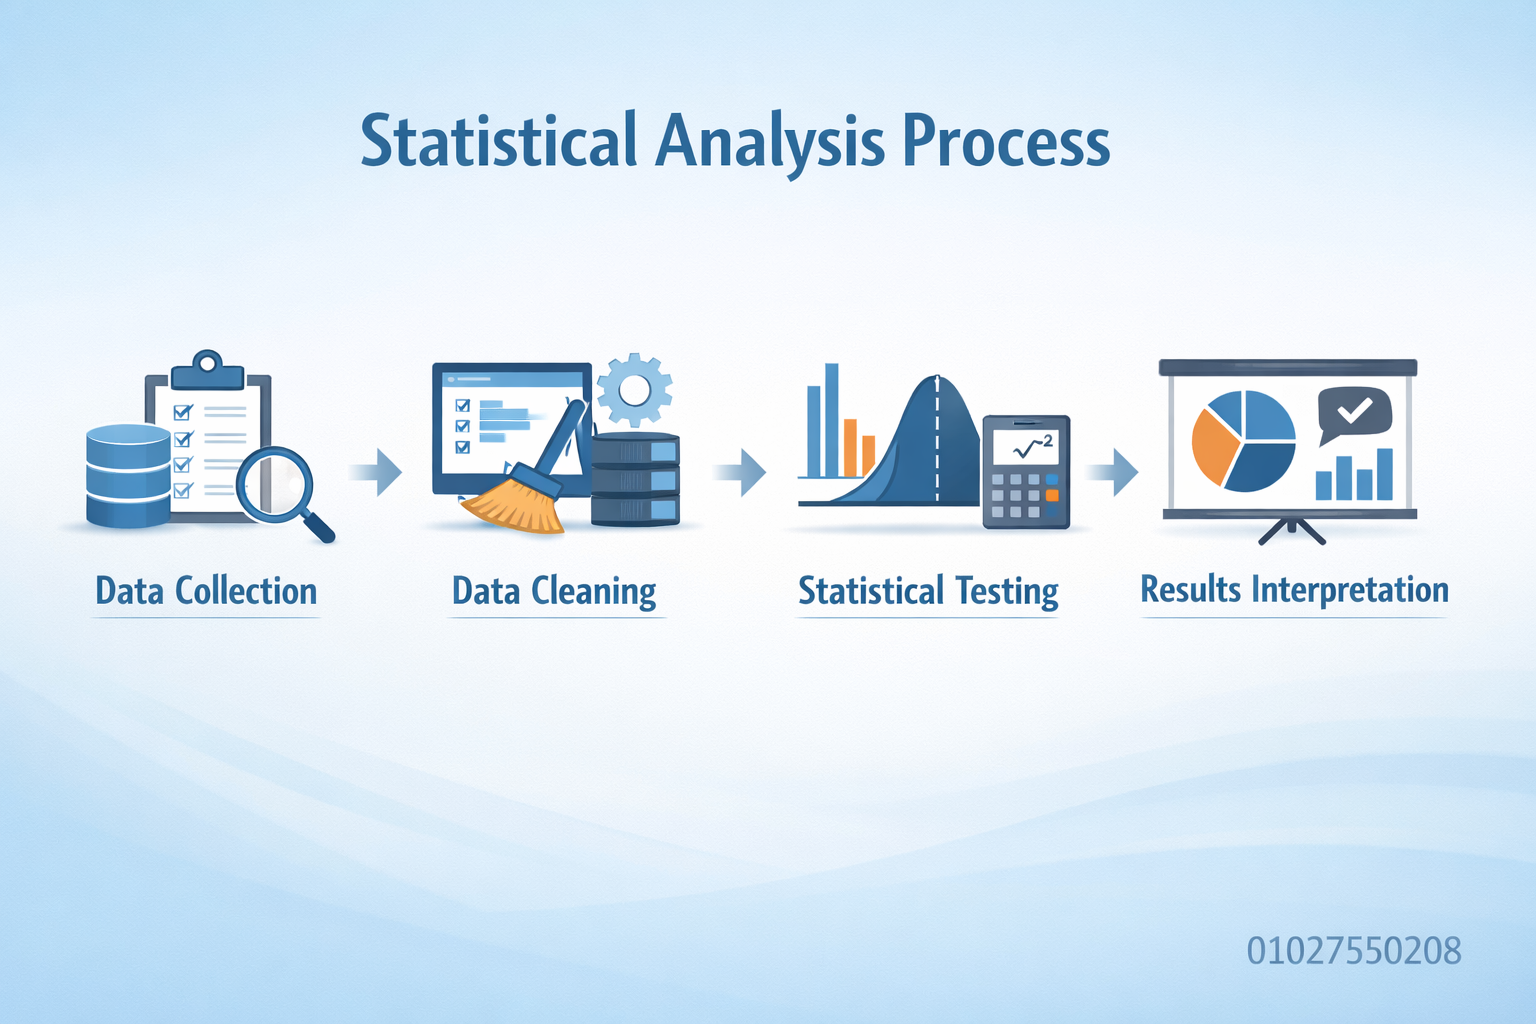
An illustration of the statistical analysis process:

مخطط يوضح خطوات عملية التحليل الإحصائي: جمع البيانات، تنظيف البيانات، الاختبار الإحصائي، وتفسير النتائج، مع رقم التواصل 01027550208

Third section: Delving deeper into the interpretation of common statistical tests

To achieve research excellence, a researcher must deeply understand how to interpret the most popular statistical tests.

1. Interpreting the T-Test

A t-test is used to compare two averages. There are three main types:
T-test type“
Purpose
Null hypothesis (H0)
One sample
Compare the sample average to the average of a known population.
There is no difference between the sample mean and the population mean.
Two independent samples
Comparing the averages of two different groups (such as males and females).
There is no difference between the averages of the two groups.
Two related samples
Compare the averages of the same group before and after implementing a program.
There is no difference between tribal and dimensional scaling.
How to interpret:
1.Read Levene's Test: In the case of a t-test for two independent samples, you must first read Levene's test to determine whether the variance is equal between the two groups (Sig. > 0.05) or unequal (Sig. < 0.05). This determines which row you will use to read the t value and the Sig value.
2.Read the Sig. (P-value):
If Sig. < 0.05we reject H0 and conclude that there is a statistically significant difference.
If Sig. ≥ 0.05we do not reject H0 and conclude that there is no statistically significant difference.
3.Determine the direction of the difference: If there is a significant difference, return to the Means table to determine which of the two groups has a higher mean.

2. Interpretation of One-Way ANOVA

Univariate analysis of variance is used to compare the averages of three or more groups (such as comparing the performance of students at three different universities).
How to interpret:
1.Read the ANOVA table:
The value of F: is the value of the test.
Sig. (P-value): is the key to the decision.
2.Statistical decision:
If Sig. < 0.05we reject H0 and conclude that there is a statistically significant difference between the means of the groups as a whole.
3.Post-hoc Tests: If the ANOVA result is statistically significant, it means that there is a difference somewhere, but it doesn't specify between which groups exactly. Here we use post-hoc tests (such as Tukey or Scheffé) to identify pairs of groups whose means are different from each other.

3. Correlation interpretation

Correlation is used to measure the strength and direction of the relationship between two quantitative variables. The most famous coefficient is Pearson's correlation coefficient (Pearson's r).
How to interpret:
1.The value of the coefficient (r): between -1 and +1.
Proximity to +1: A strong reciprocal relationship (as one variable increases, so does the other).
Proximity to -1: A strong inverse relationship (as one variable increases, the other decreases).
Proximity to 0: A weak or non-existent relationship.
2.Sig. (P-value): Determines whether the detected relationship is statistically significant.
If Sig. < 0.05The discovered relationship is not a coincidence.

4. Interpreting simple and multiple linear regression

Regression is used to predict the value of a dependent variable based on the value of one (simple) or more (multiple) independent variables.
Basic concepts in regression:
The coefficient of determination (R-squared): Represents the percentage change in the dependent variable that is explained by the independent variable(s). The closer its value is to 1, the better the predictive model.
Regression Coefficients (Beta Coefficients): It refers to the amount of change in the dependent variable per unit change in the independent variable. It determines the relative importance of each independent variable in the prediction.
Sig. value. for each coefficient: Determines whether the effect of the independent variable on the dependent is statistically significant.

Photo of a researcher analyzing data:

صورة مقربة ليد باحث يعمل على حاسوب محمول وجهاز لوحي يعرضان رسومًا بيانية متقدمة، مع رقم التواصل 01027550208

Section IV: Challenges of interpreting results and how to overcome them

The process of interpretation is not free from challenges, and the professional researcher is the one who recognizes these challenges and deals with them consciously.

1. The challenge of statistical versus practical significance

The result may be “statistically significant” (P-value < 0.05), but it may not actually be significant.
Example: You may find a statistically significant difference in the average scores of two groups, but the actual difference in the averages does not exceed one point, a difference that does not make a real change in educational practice.
Solution: Using Effect Size measures such as Cohen's d Or Eta-squared. These measures determine the strength of the relationship or the size of the difference, regardless of the sample size.

2. Common Interpretation Errors (Type I and Type II errors)

Type of error
Definition
When does it happen?
Type I Error
The null hypothesis is rejected and is true.
When P-value < 0.05, but the detected difference was chance.
Type II Error
Do not reject the null hypothesis, which is false.
When the P-value is ≥ 0.05, but a true difference is not detected (often due to small sample size).
Dealing with mistakes: The researcher must balance between these two types of error. Minimizing α (such as using 0.01 instead of 0.05) reduces Type I error but increases Type II error.

3. The Problem of Statistical Assumptions

Most parametric statistical tests (such as T-test and ANOVA) require certain assumptions to be met (e.g. normal distribution of data, homogeneity of variance).
Challenge: If these assumptions are not met, the test results may be unreliable.
Solution:
Perform hypothesis tests (such as the Shapiro-Wilk test for normal distribution).
If the assumptions are not met, the Nonparametric statistical tests (Non-parametric tests as an alternative (e.g. Mann-Whitney test instead of T-test).

4. Interpreting Non-Significant Results

A researcher may find that all of their results are “statistically insignificant”. This does not mean that the research failed, but rather that the null hypothesis was not rejected.
Correct interpretation: These results need to be bravely discussed, and logical explanations given for the lack of difference or relationship. It could be the nature of the sample, the accuracy of the instrument, or that the theoretical framework needs to be revised.
Research value: Negative results have great scientific value, as they prevent other researchers from repeating the same path and guide them towards new research paths.

Section V: Advanced skills in writing the Results and Discussion chapter

1. Structuring the results chapter

The results chapter should be organized and logical, usually following the following order:
1.Sample metadata: Describe the demographic and social characteristics of the sample (gender, age, education).
2.Results of descriptive statistics for the variables: Display the means and standard deviations of the main variables.
3.View the results of hypothesis testing: Present the results of each hypothesis separately, starting with the null hypothesis, then the test value, degrees of freedom, P-value, and finally the statistical decision.

2. The art of discussing results

The discussion is the heart of the research, the stage where the researcher appears asCritical thinker.
Linking to previous studies: Each key finding should be compared to previous studies.
Agreement: If the result agrees, it should be backed up with a logical explanation.
Difference: If the result differs, a convincing explanation must be provided and an attempt must be made to understand the reason for the difference (context, methodology, sample).
Theoretical interpretation: The discussion should be rooted in the theories and concepts on which the research was based.
Practical implications: The researcher must demonstrate how these findings can be applied in practice (in educational institutions, companies, or public policies).

3. Use tables and charts effectively

Tables: It should be simple, clear, and self-explanatory. Don't repeat everything in the text that is in the table, but focus on the main points.
Graphs: Use them to illustrate complex relationships or clear distinctions. Figures should be attractive and professional.

Toward more impactful scientific research

Mastering Interpreting the results of statistical analysis It is undoubtedly the defining skill that distinguishes an outstanding researcher from others. It is not just the end of a calculation, but the beginning of a deep intellectual process aimed at enriching knowledge and solving issues.
From understanding hypotheses to dealing with practical significance challenges, this guide provides the methodology needed to handle the output of statistical analysis with confidence and competence.
Science Club Academy We fully recognize the importance of this critical stage in the careers of researchers in Riyadh, Saudi Arabia and the UAE. We are here to provide specialized support, be it in conducting statistical analysis using the latest software, or in reviewing, auditing and in-depth interpretation of your results.
Don't let numbers get in the way of publishing your research. Contact us today to turn your data into powerful and compelling conclusions.
For specialized statistical consulting and support, contact us at

01027550208

Academic success 1200x500

Statistical analysis services: Accuracy and reliability for master's and doctoral theses in the UAE | Scientific Club Academy | 01027550208

 Statistical analysis - the compass that guides scientific research

In your graduate school journey, whether you're pursuing a master's degree or a Ph. Statistical analysis A critical turning point. It is not just a procedural step, it is the compass that guides the researcher towards drawing accurate conclusions, verifying hypotheses, and making a valuable scientific contribution. In a competitive academic environment like United Arab Emirates وSaudi ArabiaAs universities require global standards of accuracy and reliability, professional statistical analysis services become a necessity.
Many graduate students face significant challenges when dealing with big data and complex statistical equations. A researcher may be proficient in his or her discipline, but lack sufficient experience in dealing with advanced programs such as SPSS، AMOSor SmartPLS. This is where the importance of partnering with a specialized entity to ensure that the raw data is transformed into solid scientific conclusions.
Science Club Academy recognizes this challenge and offers an integrated solution that combines Statistical accuracy وAcademic reliabilityensuring that your dissertation is accepted and distinguished. This comprehensive article will highlight the critical importance of statistical analysis, the challenges facing researchers, and how professional services can be the bridge to academic success in the GCC.

Section I: Fundamentals - Statistical analysis as a cornerstone of scientific research

1.1 Definition of statistical analysis and its methodological importance

Statistical analysis It is the process of collecting, organizing, interpreting, and presenting data with the aim of discovering patterns, trends, and relationships between variables. In the context of master's and doctoral theses, statistical analysis serves the following objectives:
Hypothesis checking: It allows the researcher to test whether the hypotheses they made at the beginning of the research are true or false based on numerical evidence.
Strengthening credibility: It gives the results scientific strength and credibility, as the conclusions are supported by universally accepted mathematical and logical tools.
Making decisions: Helps make informed decisions and practical recommendations based on objective data analysis.

1.2 The relationship between methodology and statistical analysis

Statistical analysis cannot be separated from Scientific research methodology. The type of method used (quantitative, qualitative, mixed) determines the type of data to be collected, and therefore determines the appropriate statistical tools.
Type of methodology
Data type
Examples of statistical tests
Quantitative approach
Digital data (surveys, experiments)
T-test, analysis of variance (ANOVA), regression
Qualitative approach
Text data (interviews, notes)
Content analysis, thematic analysis (may require statistical coding)
Mixed approach
A combination of digital and textual data
Sequential or concurrent analysis requires the integration of quantitative and qualitative test results
Choosing the wrong statistical tool can lead to misleading results, putting the dissertation at risk of rejection. Therefore, the Accuracy At this point it is the key to Reliability.

Section II: Statistical Analysis Challenges Facing Graduate Students

Despite the importance of statistical analysis, it represents a major obstacle for many researchers. These challenges range from technical to methodological difficulties.

2.1 Statistical complexity and advanced modeling

As research evolves, there is an increasing need to use more complex statistical models, such as:
Structural equation modeling (SEM): that allow testing complex relationships between latent (indirect) variables.
Factor Analysis: to determine the basic dimensions of a set of variables.
Multiple Regression Analysis: to estimate the effect of several independent variables on a single dependent variable.
Working with these models requires a deep understanding of statistical theory, which may not be available to researchers who are not specialized in statistics.

2.2 Choosing the right statistical test

Determining the correct statistical test based on the type of data (nominal, ordinal, categorical, proportional), sample size, and data distribution (normal or non-normal) is one of the most difficult stages. For example, using a parametric test (such as the t-test) for data that does not follow a normal distribution is a serious methodological error.

2.3 Mastery of statistical programs (SPSS, AMOS, SmartPLS)

Statistical programs require professionalism. It is not enough to enter the data and press the “Analyze” button, you need to understand the options available, how to do Data Cleaning, deal with Missing Values, and read the program outputs correctly.

2.4 Interpreting the results and relating them to the theoretical framework

Statistical analysis is not complete without Interpretation of results and relate it to the theoretical framework and previous studies. The researcher must clearly explain what the numbers mean statistically, and what they mean in the context of the research issue. This linkage requires high analytical skill.

Section III: Professional Statistical Analysis Services - The Bridge to Excellence

Hiring specialized services in statistical analysis is an investment in the quality of the dissertation and the speed of its completion. Progress Science Club Academy A full range of services tailored to meet the needs of master's and doctoral students in the UAE and Saudi Arabia.

3.1 Comprehensive service phases to ensure accuracy and reliability

To ensure the highest levels of quality, the Academy follows a structured work methodology that includes:

The first stage: Data Cleaning and Screening

Before any analysis can begin, the integrity of the data must be confirmed. This stage includes:
Examine outliers: Identify and manage values that may negatively affect the results of the analysis.
Dealing with missing data: Use advanced statistical methods to compensate or exclude missing data in a systematic way.
Examine statistical assumptions: Ensure that the data meets the assumptions needed for the chosen tests (e.g., normal distribution, homogeneity).

Second Stage: Applying Statistical Testing

The most appropriate statistical tests are applied to the hypotheses and type of data, using the latest software. Emphasis is placed on:
Descriptive Statistics: Calculate means, standard deviations, frequencies, and percentages to describe the characteristics of the sample.
Inferential Statistics: Perform hypothesis tests (e.g., regression, path analysis, comparisons) to draw conclusions about the larger community.

Third stage: Interpreting the results and writing the statistical chapter

This is the most important stage, where numbers are converted into understandable academic language. They are presented:
Professional tables and charts: They are prepared according to academic publishing standards (e.g. APA).
Accurate interpretation of the outputs: Explain the significance of each statistical test, P-value, correlation coefficients, and effect sizes.
Linking results to hypotheses: Clearly and directly answer the research questions and verify the hypotheses.

3.2 Experience with advanced statistical programs

The quality of the analysis depends on the analyst's expertise in using the right tools. She specializes Science Club Academy In:
Statistical program
Main use
Advantages for the researcher
SPSS (Statistical Package for the Social Sciences)
Descriptive analysis, basic hypothesis tests (T-test, ANOVA, Regression).
Easy to use, suitable for most research in the social sciences and humanities.
AMOS (Analysis of Moment Structures)
Covariance-Based SEM (Structural Equation Modeling).
Perfect for testing complex theoretical models and cause-and-effect relationships.
SmartPLS
Structural Equation Modeling (SEM) based on Partial Least Squares SEM.
Useful when dealing with small samples or complex predictive models, common in management and business research.
R/Python
Advanced Analytics, Machine Learning, Big Data Analytics.
It offers high flexibility and the ability to handle non-traditional statistical algorithms.

Section IV: Regional Excellence - Statistical Analysis Services in the UAE and Saudi Arabia

The academic environment at Emirates وSaudi Arabia with unique characteristics that require specialized statistical analysis services.

4.1 Academic Quality Standards in the UAE

The UAE is a global center for higher education, with campuses of top international universities. This requires:
Adherence to international publishing standards: The results should be publishable in peer-reviewed scientific journals with a high impact factor.
Rigor in methodology: Extreme scrutiny of sample selection, measurement tools, and the application of statistical tests.
Fast turnaround time: Given the limited time available to working researchers, delivering service quickly and efficiently is critical.

4.2 Supporting Saudi Arabia's Vision 2030 through scientific research

The Kingdom of Saudi Arabia attaches great importance to scientific research as a key pillar for achieving Vision 2030. This focus requires:
Relevant applied research: The need for statistical analysis to support research on economic development, technology, and energy.
Dealing with government and private sector data: Ability to analyze large and complex datasets from official sources.
Practical interpretation of the results: Transforming statistical results into actionable recommendations to support decision makers.

4.3 Reliability and confidentiality: Academy guarantees

In the field of academic services, the Confidentiality وReliability Key Factors. The Academy is committed to:
complete confidentiality: Ensure that research data or results are not shared with any third party.
Academic review: The statistical analysis is reviewed by specialists with advanced degrees to ensure it is error-free.
Continuous support: Providing support to the researcher until the defense stage, and answering the queries of the supervisory committee.

Section VI: Detailing advanced statistical analysis programs (content deepening)

To achieve the required depth, the previously mentioned statistical tools must be customized.

6.1 SPSS: The indispensable foundation

SPSS (Statistical Package for the Social Sciences) is the most popular program in academia.
Uses: Questionnaire analysis, descriptive statistics, comparison tests (T-test, ANOVA), correlation analysis and linear regression.
Strengths: Easy user interface, high ability to clean and manage data.
Service provided: Provide comprehensive analysis using SPSS, with tables and graphs output in a message-ready format.

6.2 AMOS program: Mastering Structural Equation Modeling (SEM)

When the relationships between variables become complex, the AMOS is the perfect choice.
Uses: Testing Measurement Models and Structural Models, path analysis.
Strengths: Ability to deal with Latent Variables and provide a clear graphical representation of the model.
Service provided: Structural model building, model fit evaluation, and path coefficient interpretation.

6.3 SmartPLS: Predictive modeling solutions

SmartPLS PLS-SEM is specialized software for modeling structural equations using partial least squares methodology and is gaining increasing popularity.
Uses: Predictive research, complex models with multiple relationships, research that relies on small samples or non-normally distributed data.
Strengths: Doesn't require strict assumptions about the data distribution, and is effective in forecasting.
Service provided: PLS-SEM analysis, reliability and validity test, and Importance-Performance Map Analysis.

Section VII: Researcher's Guide - How to ensure the accuracy of the statistical analysis of your dissertation?

To get the most out of statistical analysis, a researcher must follow systematic steps:

7.1 Pre-planning the methodology

The methodology and statistical tools required in Research Proposal. Don't wait until the data collection phase to think about analysis.

7.2 Quality of data collection

Statistical analysis cannot compensate for poor data. It must be ensured that:
Validity and reliability of measurement tools: Ensure that the questionnaires or scales used have been pre-tested.
Appropriate sample size: The sample size must be sufficient to perform the required statistical tests.

7.3 Effective communication with the statistical analyst

The statistical analyst must be provided with all necessary information:
Research plan and hypotheses.
The theoretical framework of the thesis.
Raw data in an organized format (such as Excel or SPSS).

Your partner towards academic excellence

Succeeding in a master's or doctoral thesis requires more than just effort; it requires Accuracy وProfessional at every stage, especially in statistical analysis. Partnering with Science Club Academy It ensures that you turn your data into reliable and publishable scientific results.
We are committed to providing statistical analysis that goes beyond simply crunching numbers and focuses on Deep interpretation وSystematic binding that enriches your thesis and ensures you stand out in the discussion.
Don't let the complexities of statistics get in the way of your academic career.
To contact and inquire about advanced statistical analysis services in the UAE and Saudi Arabia:
Science Club Academy

Telephone: 01027550208

Section VIII: Technical details of the advanced statistical analysis process

To achieve the rigor and reliability that master's and doctoral theses require, it is necessary to delve into the technical aspects of the statistical analysis process. These details are what distinguish a professional service from a superficial work.

8.1 Data cleaning and preparation: The first step toward reliability

The quality of the input data is the decisive factor in the quality of the results. No advanced statistical analysis can compensate for unclean or unorganized data.

8.1.1 Examining Outliers

Anomalous values are data points that deviate significantly from the rest of the data and can significantly skew the means and standard deviations, thus affecting the results of hypothesis tests. Statisticians identify these values using methods such as:
Box Plot: to identify values that fall outside the upper and lower bounds.
Standard Deviation Criterion: Identify values that are more than 3 standard deviations away from the mean.
An informed decision is then made on the treatment of these values, whether to exclude them (with systematic justification) or statistically transform them.

8.1.2 Dealing with Missing Data

Missing data are common in field research, and handling them incorrectly can lead to biased results. Missing data is categorized (e.g. completely randomly missing MCAR, or randomly missing MAR) and an appropriate compensation method is chosen:
Listwise Deletion: Discard the entire case if it contains any missing value (only appropriate if the missing value is very small).
Mean Imputation: Replace the missing value with the mean of the variable (a simple method but may reduce the variance).
Multiple Imputation: This is the most advanced method, where several complete datasets are created based on statistical estimations, and then the results of the analysis are merged.

8.1.3 Statistical Assumptions Testing

Before applying any parametric test (e.g. regression or t-test), make sure that the basic assumptions are met, the most important of which are:
Normality: Test whether the data follows a normal distribution using tests such as Kolmogorov-Smirnov Or Shaviro-Wilk.
Homogeneity of Variance: Ensure that the variance of the dependent variable is equal across levels of the independent variable, using the Levene's Test.
Linearity: Ensure that there is a linear relationship between the variables in the regression models.

8.2 Multiple Regression Analysis: Predicting and Understanding Relationships

Multiple regression analysis is one of the most powerful statistical tools for understanding and predicting relationships between variables.

8.2.1 Advanced Regression Types

Logistic Regression: Used when the dependent variable is binary (e.g., yes/no, pass/fail).
Path Regression (Path Analysis): It is a simplified form of structural equation modeling, used to test direct and indirect causal relationships.
Hierarchical Regression: It is used to test the explanatory power of a set of independent variables after controlling for the influence of another group.

8.2.2 Interpreting regression coefficients

Professional service is not limited to outputting a value R-squared (which refers to the proportion of variance explained), but includes a precise interpretation of Beta Coefficientswhich explains:
Relationship direction: Are they positive or negative?
Strength of the relationship: What is the magnitude of the change in the dependent variable for one unit of change in the independent variable?
Statistical significance: Is the relationship statistically significant at a certain level (usually 0.05)?

8.3 Analysis of variance (ANOVA): Effectively comparing groups

Analysis of Variance is used to compare the means of three or more groups. It is an essential tool in experimental and quasi-experimental research.

8.3.1 Types of analysis of variance

One-Way ANOVA (One-Way ANOVA): to compare group means based on a single independent variable.
Two-Way ANOVA: To study the effect of two independent variables and their interaction on one dependent variable.
MANOVA (Multivariate Analysis of Variance): It is used when there is more than one dependent variable, allowing differences between groups to be tested on a range of dependent variables simultaneously.

8.3.2 Post-Hoc Tests

If the ANOVA analysis shows a statistically significant difference between groups, post hoc tests (e.g. Tukey Or Scheffé) is necessary to determine exactly which groups are different from each other. It is this detail that adds real value to the analysis.

Section IX: The role of statistical analysis in various academic disciplines

The need for statistical analysis is not limited to one discipline, but is a cross-disciplinary necessity, each of which requires different statistical tools.

9.1 Business and Finance

In management and business disciplines, the statistical analysis of
Market analysis: Use multiple regression to identify factors affecting consumer demand or stock prices.
Human Resource Management: Use factor analysis to determine the dimensions of job satisfaction or organizational commitment.
Structural equation modeling (SEM): To test complex theoretical models in consumer behavior or technology adoption.
Applied example: A financial management researcher may use Time Series Analysis to forecast oil prices in light of macroeconomic variables, an analysis that requires specialized expertise.

9.2 Education and Social Sciences

In these disciplines, analysis focuses on measuring intangible phenomena (e.g. intelligence, anxiety, attitudes).
Item Analysis: To assess the quality of measurement tools (tests and questionnaires).
Repeated Measures ANOVA: To study the effect of a training program on a single group measured before and after the program.
Mixed Methods Analysis: Integrate the results of qualitative interviews with those of quantitative questionnaires to provide a comprehensive picture.
Applied example: can be used Logistic regression analysis To identify factors that increase the likelihood of students dropping out of higher education in the UAE.

9.3 Health and Medical Sciences

Medical research relies heavily on biostatistics to ensure the safety and effectiveness of treatments.
Survival Analysis: To study the length of time until a certain event (such as death or relapse) occurs.
Diagnostic Tests: Calculate the sensitivity, specificity, and predictive value of medical tests.
Clinical Trials: Comparison tests (T-test, Chi-square) were used to evaluate the differences between the treatment and control groups.
Applied example: Use Multiple Regression Analysis To identify risk factors associated with diabetes in the Saudi community.

Section X: Quality and Excellence Standards

The obligation of Science Club Academy With international quality standards, researchers in the UAE and Saudi Arabia are assured of impeccable academic work.

10.1 Adherence to academic documentation standards (APA, MLA, Chicago)

Statistical analysis is not just about the numbers, it's about the way those numbers are presented. All tables, figures and graphs are prepared according to the latest versions of internationally recognized academic documentation systems, such as APA (American Psychological Association)to ensure its direct acceptance into the dissertation.

10.2 Ensuring results are free of statistical and methodological errors

Double-Check is performed for all stages of the analysis:
1.Review the entry: Ensure that the coding and entry of data is error-free.
2.Review the test: Ensure that the chosen statistical test is fully consistent with the research hypotheses and the type of data.
3.Review the interpretation: Ensure that the interpretation of the results is consistent with the statistical outputs and scientific significance.

10.3 Technical and academic support until the discussion stage

The service does not end with the delivery of the analysis file. The Academy team is committed to providing full support to the researcher:
Respond to supervisor inquiries: If the supervisor requires additional modifications or clarifications to the statistical analysis.
Preparing for the discussion: Provide the researcher with a simplified and detailed explanation of the statistical results to enable them to defend them confidently in front of the discussion committee.
Free adjustments: Make any statistical adjustments required by the oversight or discussion committee within a specified time period.

Section XII: Final Conclusion and Next Step

Choosing the right partner to conduct statistical analysis is a crucial decision that affects the future of your dissertation. Science Club Academy offers you not only an analytics service, but Academic partnership guarantees you:
Accuracy: in applying the latest statistical methods and tests.
High reliability: In interpreting the results and relating them to the theoretical framework.
Academic excellence: in presenting the Results and Discussion chapter in a professional and ready-to-discuss manner.
We're here to make your academic journey in the UAE and Saudi Arabia smoother and more successful.
To connect directly with statistical experts and start analyzing your dissertation:
Science Club Academy

Telephone: 01027550208

Spss data viz 1200x500

SPSS statistical analysis: Your comprehensive guide for researchers and graduate students in Saudi Arabia and the UAE

 The Age of Data and the Statistical Imperative

Nowadays, scientific research and academic studies, especially at the master's and doctoral levels, rely heavily on collecting and analyzing massive amounts of data. It is no longer limited to proposing hypotheses, but requires proving or disproving them with conclusive digital evidence. This is where the importance of SPSS statistical analysis As an indispensable tool for every researcher who seeks to excel and make a real contribution to their field.
Researchers andGraduate students in Saudi Arabia وEmirates They face a double challenge: Adhering to the strict academic standards imposed by prestigious universities such as King Saud University, King Abdulaziz University, and the United Arab Emirates University, in addition to the need to produce high-quality research that can be published in peer-reviewed scientific journals. This requires mastery of statistical analysis tools, primarily the SPSS program.
This comprehensive guide, provided by Science Club Academyis your gateway to understanding and mastering SPSS, from its basics to its advanced techniques, with an emphasis on practical applications that serve the needs of scientific research in the region.

1. What is SPSS and why is it the first choice for researchers?

SPSS, an acronym for Statistical Package for the Social Sciences (Statistical Package for the Social Sciences) is an integrated software system designed by IBM specifically to perform all kinds of statistical analyses. Although its original name refers to the social sciences, its use has expanded to broad fields such as medicine, economics, business, education, and engineering.

1.1. A short historical journey

SPSS was first developed in 1968, and since then, it has gone through many developments to become the most popular statistical tool in academia around the world. Its ease of use, intuitive graphical interface, and ability to handle large datasets have made it the preferred choice for researchers who may not be deeply specialized in statistics.

1.2. Competitive Advantages of SPSS

Feature
Description and importance to the researcher
Ease of use (GUI)
A simple graphical interface that enables the researcher to perform complex analyses in a few clicks, without the need to write code.
Statistical comprehensiveness
The program covers all statistical tests, from simple descriptive (means and deviations) to advanced inferential (regression, path analysis).
Effective data management
It provides powerful tools for cleaning data, recoding variables, and creating new variables, ensuring accurate analysis.
Output quality
Provides clear and detailed results in professional tables and graphs, ready for direct inclusion in master's and doctoral theses.
Academic compatibility
The program is considered the basic standard for statistical analysis in most Arab and international universities, ensuring the acceptance of the statistical methodology of the research.

2. The basic structure of the SPSS program: Two main windows

To understand how SPSS works, a researcher must understand that the program basically consists of three main windows that work together:

2.1. Data Editor window

This is the window where data is entered and variables are defined. It is divided into two main screens:

A. Data View

This is where the numeric values of the data are entered. Each row represents a case (such as a respondent in a survey), and each column represents a variable (such as age, gender, or answer to a specific question).

B. Variable View

This screen is the heart of the data preparation process. It is where the properties of each variable are precisely defined, including:
Name: A short name for the variable.
Type: Data type (numeric, text, date).
Label: A full description of the variable (e.g., “degree of satisfaction with service quality”).
Values: Define the numeric coding of text values (e.g., 1=strongly agree, 5=strongly disagree).
Measure: Specify the type of statistical measure (nominal, ordinal, categorical/relative). This part is vital because it determines what type of statistical tests are allowed.

2.2. Output Viewer

This window shows all the results of the statistical analyses performed by the researcher, as well as graphs and tables. It is very important that the researcher learns how to read and interpret these outputs, not just copy and paste them.

2.3. Syntax Editor window - Pro

Although the graphical interface is sufficient for most analyses, advanced researchers use the Syntax window to write code directly. This ensures reproducibility and makes it easier to perform complex or repeated analyses on different datasets.

3. Methodological steps for statistical analysis using SPSS

Statistical analysis is not a random process, but an organized approach that ensures that the results are accurate and reliable. Researchers typically follow the following steps:

3.1. Step one: Data Preparation and Cleaning

This step is the most important of all, as “Garbage In, Garbage Out”.

A. Data entry and definition

As mentioned, data is entered in the Data View window and precisely defined in the Variable View. You must ensure that all variables are properly coded and their measures are precisely defined.

B. Checking Missing Values

The cause of the missing data (is it random or systematic?) must be identified and dealt with by appropriate statistical methods (such as replacing the average or using advanced techniques such as Multiple Imputation).

c. Detecting Outliers

Outliers are data points that deviate significantly from the rest of the data and can negatively affect the results of statistical tests. Researchers use tools such as boxplots or the Z-Score to identify them and deal with them by either correcting or excluding them (with academic justification).

3.2. Second Step: Descriptive Statistics

Before moving on to hypothesis testing, the researcher must describe the characteristics of the sample and the data collected. This gives the reader a clear picture of the nature of the data.
Statistical scale
Description
SPSS function
Measures of centralization
Mean, Median, Median, Mode.
Know the typical or centralized value of the data.
Dispersion scales
Standard Deviation, Range, and Variance.
Measures how far or close the data is to the mean.
Shape scales
Skewness, Kurtosis.
Determine the shape of the data distribution (is it a normal distribution?).
Frequencies and percentages
Distribution of sample members according to demographic variables (gender, age, educational level).
Accurately describe the characteristics of the sample.

3.3. Step three: Inferential Statistics and Hypothesis Testing

This is where the most important part begins, using statistics to infer the characteristics of a population based on sample data, and to test research hypotheses. The choice of test depends on the type of variables (quantitative or qualitative) and the number of groups to be compared.

A. Comparison Tests

T-Test: It is used to compare the average of two groups (such as comparing male and female performance).
Analysis of variance (ANOVA): It is used to compare the average of three or more groups (such as comparing the performance of students from three different universities).

B. Relationship Tests

Correlation coefficient: It is used to measure the strength and direction of the relationship between two variables (such as the relationship between study hours and academic achievement).
Regression Analysis: It is used to predict the value of a dependent variable based on one or more independent variables.

4. Advanced statistical analysis: Beyond the basics

To produce high-impact doctoral or advanced research, researchers often need to go beyond basic tests and use more complex statistical techniques.

4.1. Factor Analysis

This analysis is used to reduce a large number of variables to a smaller number of underlying factors (Constructs). It is very necessary when constructing or validating measurement instruments (such as questionnaires).

4.2. Analysis of Multiple Variance (MANOVA)

It is used when a researcher has more than one quantitative dependent variable and wants to compare the effect of one or more independent variables on these dependent variables combined.

4.3. Logistic Regression Analysis

It is used when the dependent variable is a binary variable (e.g., pass/fail, agree/disagree). This type of analysis is common in medical and economic research.

5. Regional context: SPSS at universities in Saudi Arabia and the UAE

The requirements for statistical analysis at leading universities in the region are rigorous and demanding.

5.1. Academic Quality Requirements

Supervisory and discussion committees at Saudi and Emirati universities (e.g. King Fahd University of Petroleum and Minerals, Zayed University, University of Sharjah) require the following:
1.Adhere to the hypotheses of the tests: The researcher must ensure that their data meets the statistical assumptions of each test (e.g., the assumption of normal distribution in parametric tests).
2.Deep interpretation of results: It is not enough to display tables, the results must be linked to theory and previous literature, and statistical and practical significance must be interpreted.
3.Use the latest versions: The latest version of SPSS is preferred to ensure accuracy and compliance with modern standards.

5.2. Common Challenges for Graduate Students

Challenge
Scientific Club Academy's proposed solution
Difficulty choosing the right test
Provide specialized consultations to determine the optimal statistical test based on the nature of the data and hypotheses.
Data cleaning issue
Help address missing and anomalous values to ensure data integrity prior to analysis.
Interpreting complex outputs
Provide detailed analytical reports explaining each table and graph, linking them to the research objectives.
Lack of time before the discussion
Provide fast and accurate statistical analysis service to meet deadlines.

8. Conclusion and next steps

It has become SPSS statistical analysis It is the lingua franca of rigorous scientific research. Mastering this tool opens doors to scientific publication and academic success. Whether you are Graduate student in Saudi Arabia Or Researcher in the UAEInvesting in the quality of your statistical analysis is an investment in your career.
Don't let the complexities of statistics hold you back. Reach out to the experts at Science Club Academy Today, let us help you turn your data into a scientific success story.

4. Deep dive into inferential statistics: A Practical Guide to Key Tests in SPSS

The essence of scientific research lies in testing hypotheses, turning theoretical questions into numerical conclusions supported by evidence. The SPSS program provides a wide range of statistical tests that meet all research needs. Here we will focus on the three most important tests that are essential for graduate research.

4.1. T-Test: Comparing averages accurately.

One of the most common and simple tests is the t-test, which is used to compare two means. The researcher must determine which type of t-test is appropriate for their hypothesis:

A. One-Sample T-Test

It is used to compare the average of a single sample to a previously known average or normative value (e.g. comparing the average score of master's students at a particular university to a known national average).

B. Independent Samples T-Test

It is used to compare the average of two very different groups (such as comparing the level of anxiety in males and females, or comparing the performance of two different training groups).
Implementation steps in SPSS:
1.from the list: Analyze -> Compare Means -> Independent-Samples T Test...
2.Enter the dependent (quantitative) variable in the Test Variable(s).
3.Enter the independent (dichotomous) variable in the Grouping Variable.
4.Identify the two groups (e.g., 1 for males, 2 for females) in Define Groups.

Interpretation of results:

The focus is on the value of Sig. (2-tailed). If this P-value is less than the usual significance level (0.05), it means that there is a statistically significant difference between the means of the two groups, and the null hypothesis is rejected. You should also look at the Levene's Test for Equality of Variances to determine which row to read the t value from (assuming equal or unequal variances).

4.2. One-Way Analysis of Variance (One-Way ANOVA): Comparing more than two groups

When a researcher wants to compare the means of three or more groups (e.g. comparing job satisfaction between three different managerial levels: Supervisory, Executive, Senior), analysis of variance (ANOVA) becomes the appropriate tool.
Objective: Determine whether there is a statistically significant difference between the means of the groups as a whole.
Implementation steps in SPSS:
1.from the list: Analyze -> Compare Means -> One-Way ANOVA...
2.Enter the dependent (quantitative) variable in the Dependent List.
3.Enter the independent variable (categorical with three or more levels) in the Factor.
4.Pressing on Post Hoc Choose tests for dimensional comparisons (such as Tukey or Scheffé) to determine exactly which groups differ from each other, if the overall ANOVA result is significant.

Interpretation of results:

Focusing on the ANOVA and value Sig. (P-value). If it is significant (less than 0.05), we move on to the Post Hoc Tests to determine the source of the difference.

4.3. Multiple Linear Regression Analysis: Prediction and Causal Relationships

Regression analysis is one of the most powerful statistical tools, as it not only describes the relationship, but seeks to predict the value of a dependent variable (such as academic performance) based on a set of independent variables (such as study hours, level of motivation, family support).
Objective: Build a mathematical model that describes the relationship between the variables, and determine the extent to which each independent variable contributes to explaining variation in the dependent variable.
Implementation steps in SPSS:
1.from the list: Analyze -> Regression -> Linear...
2.Enter the dependent (quantitative) variable in the Dependent.
3.Enter the independent variables (quantitative or binary) in the Independent(s).
4.Choose an input method (e.g. Enter to enter all variables at once).
Interpretation of results:
1.Model Summary Table: Focus on the value of R Square (the square of the multiple correlation coefficient), which indicates the percentage of variance in the dependent variable explained by the model.
2.ANOVA table: Focus on the value of Sig.which determines whether the model as a whole is statistically significant.
3.Table Coefficients: This is the most important, where it displays:
B value (unstandardized regression coefficient): is used to write the regression equation.
Beta value (standardized regression coefficient): Used to compare the relative importance of the independent variables in predicting the dependent variable.
Sig. (P-value): to determine which of the independent variables makes a statistically significant contribution to the prediction.

5. Careful data preparation: The key to statistical reliability

The importance of the data preparation phase cannot be overstated. It is the foundation upon which the entire analysis is built. Researchers and graduate students in Saudi Arabia and the UAE should pay special attention to these details to ensure that their research is accepted.

5.1. Variable Coding

In a window Variable Viewthe notation should be logical and standardized:
Nominal variables: Like gender (1=male, 2=female).
Ordinal variables: Such as educational level (1=Bachelor's, 2=Master's, 3=PhD).
Likert Scales: Coding should be consistent (e.g., 5 for strongly agree, 1 for strongly disagree).

5.2. Dealing with Missing Data

Missing data is a common challenge. The researcher must decide how to deal with it based on the proportion and type of loss:
Listwise Deletion: Exclude the entire case if it contains any missing value. Appropriate if the loss ratio is less than 5%.
Mean Imputation: Replace the missing value with the average values of the variable. Not recommended for advanced research because it reduces variance.
Regression Imputation: Use a regression model to predict the missing value based on other variables.
Multiple Imputation: This is the most accurate and statistical method, where multiple compensated datasets are created.

5.3. Checking the Normality Assumption

Many parametric tests (such as T-test and ANOVA) rely on the assumption that the data follows a normal distribution. This can be checked in SPSS via:
1.Statistical tests: Test Kolmogorov-Smirnov و Shapiro-Wilk. If the Sig. is greater than 0.05, it indicates that the data is normally distributed.
2.charts: Using Histogram and Q-Q Plot.
If the assumption of a normal distribution is not met, the researcher must resort to Non-Parametric Testssuch as testing Mann-Whitney U instead of a t-test, or a Kruskal-Wallis instead of ANOVA.

6. The art of interpreting results and writing the statistical chapter in the dissertation

The biggest challenge for the researcher is not in running the tests in SPSS, but in Interpretation Results and their integration into the context of academic research. The results chapter (usually Chapter 4) should be clear, organized, and persuasive.

6.1. Methodological structure for separating results

The separation of results should follow a logical sequence:
1.Description of the sample and data: Display frequencies and percentages for demographic variables.
2.Descriptive statistics for key variables: View the averages and standard deviations of the study dimensions.
3.View the results of hypothesis testing: Present the results of each hypothesis separately, starting with the null hypothesis.

6.2. How to display statistical tables (APA Style)

Most universities require statistical tables to be presented in a APA (American Psychological Association)which is characterized by simplicity and a focus on data:
Address: It should be clear, concise, and placed above the table.
Lines: Only horizontal lines should be used, avoiding vertical lines.
Coding: Use standardized statistical symbols (e.g. * for significance at 0.05, and ** for significance at 0.01).

6.3. Statistical versus empirical interpretation

Statistical interpretation: Relates to the P-value. If P < 0.05, the result is statistically significant.
Effect Size: It's about how significant the difference or relationship actually is. A result may be statistically significant, but the Effect Size is too small, reducing its practical significance. The researcher should report measures of effect size (such as Cohen's d or Eta Squared) to enhance the credibility of the results.

7. SPSS at the service of Saudi Vision 2030 and UAE Vision 2071

Proficient statistical analysis is not just an academic requirement, but an essential pillar for achieving ambitious national goals in both Saudi Arabia and the UAE.

7.1. Data-driven decision support

in Saudi Arabia (Vision 2030): National transformation programs, such as the development of the education and health sector, rely on rigorous research that uses SPSS to analyze key performance indicators (KPIs) and evaluate the effectiveness of initiatives.
in the UAE (Centennial 2071): The UAE seeks to be a global leader in various fields, and this requires advanced data analysis in the areas of innovation, artificial intelligence, and entrepreneurship.

7.2. The importance of international scientific publishing

Highly ranked peer-reviewed journals (Q1, Q2) require an advanced level of statistical analysis. Mastering SPSS ensures that the statistical methodology of the research is robust and globally accepted, raising the ranking of universities and research institutions in the region.

8. Science Club Academy: Why we're your best choice?

We are in Science Club Academy We understand the pressures faced by researchers and graduate students. Our extensive experience in dealing with the requirements of Saudi and UAE universities ensures that you get statistical analysis that is not only accurate, but also deeply interpretable and theoretically relevant.

8.1. Our specialized services in SPSS statistical analysis

Service
Details and guarantees
Statistical audit
A thorough review of your data file and analyses to ensure they are free of methodological and statistical errors.
Comprehensive analysis
Take all required tests (from descriptive to advanced) with a detailed interpretive report.
Data processing
Data cleaning, handling missing values, and verifying test assumptions.
Continuous support
Follow up the researcher until the discussion stage and respond to the supervisors' inquiries.

8.2. Contact us now

Don't waste your time trying to decipher complex statistics. Focus on the theoretical and methodological aspects of your research, and leave the statistical analysis to us.

For direct communication and service request in Saudi Arabia and the UAE:

telephone: 01027550208

9. Conclusion: Toward rigorous scientific research

In this comprehensive guide, we've provided you with a complete roadmap for mastering SPSS statistical analysisfrom data preparation to interpretation of advanced results. Your commitment to statistical quality is what will characterize your research and ensure your academic excellence.
Science Club Academy is your trusted partner on this journey. Contact us today to turn your data into powerful scientific conclusions.

10. Data quality assurance: Reliability and Validity

Before conducting any inferential analysis, the researcher must ensure that the measurement tool (questionnaire or test) used is Valid وFixed (Reliable). This is a crucial step in quantitative research, and is conducted entirely using SPSS.

10.1. Reliability Test: Cronbach's Alpha.

Stability means that the instrument gives roughly the same results if it is applied again under the same conditions.
How to implement in SPSS:
1.from the list: Analyze -> Scale -> Reliability Analysis...
2.Enter all the items of the scale to be tested for stability in the Items.
3.Make sure to choose Alpha in the Model.
Interpretation of results:
Cronbach's alpha coefficient is considered acceptable if 0.70 and above.
The ideal value of advanced academic research is often 0.80 and above.
If the value is low, the researcher should check the Item-Total Statistics to determine which paragraphs should be deleted to increase the value of the coefficient.

10.2. Validity Test: Construct Validity

Validity means that the instrument actually measures what it was designed to measure. There are several types of validity, the most common in SPSS is construct validity, which is verified by:

A. Face Validity and Content Validity

They are usually verified by showing the tool to a group of specialized adjudicators (usually 5-10 adjudicators) before the actual application.

B. Criterion-Related Validity

It is verified by the correlation coefficient between the tool's scores and the scores of another well-known and reliable tool that measures the same concept.

c. Factorial Validity

This is the most powerful technique, using Exploratory Factor Analysis (EFA) in SPSS.
Objective: Ensure that the paragraphs are grouped under the factors (dimensions) hypothesized by the theoretical framework of the study.
Main tests:
Kaiser-Meyer-Olkin (KMO): Its value should be higher than 0.60.
Bartlett's Test of Sphericity: It must be statistically significant (Sig. < 0.05).
Results: The number of factors is determined using the Eigenvalue (eigenvalue) greater than 1, and the Rotated Component Matrix is examined to ensure that each item is correlated with only one factor with a high correlation strength (typically 0.40 and above).
Mastering these tests ensures that academic research is not only well analyzed, but is based on data collected with reliable and valid measurement tools, which is what characterizes research published in international journals.

11. References

1.IBM SPSS Statistics. (2024). Official Documentation and User Guide.
2.Field, A. (2018). Discovering Statistics Using IBM SPSS Statistics. SAGE Publications.
3.Pallant, J. (2020). SPSS Survival Manual: A Step by Step Guide to Data Analysis using IBM SPSS. Routledge.
4.Saudi Vision 2030. (2024). Data-Driven National Transformation.
5.UAE Centennial 2071. (2024). Innovation and Research Strategy.
متخصص التحليل الإحصائي

Statistical Analyst – Reliable Statistical Solutions

Many graduate students in Saudi Arabia face significant challenges in their academic research. Many master's and doctoral theses receive feedback or even rejection due to avoidable methodological errors.

We offer a comprehensive solution to these challenges. Statistical analysis It is not just running a computer program, but an integrated systematic process that starts with a correct understanding of the scientific method and ends with the accurate interpretation of the results.

We believe that Scientific research A good one relies on a strong statistical foundation. So we make sure to choose the right tests for each study, and help interpret Results scientifically accurate.

We use the latest specialized software such as SPSS, AMOS, and SmartPLS. We guarantee accurate results that meet Saudi university standards and strongly support your research hypotheses.

Key points

  • Statistical analysis is essential to the success of scientific research
  • Choosing the right tests ensures reliable results
  • Correct scientific interpretation of data improves research quality
  • We comply with the requirements of Saudi universities
  • We use state-of-the-art specialized software
  • We support researchers in all disciplines

Statistical analysis: More than just running a program

The quality of statistical analysis goes beyond technical operation to the depth of scientific understanding. We believe that Excellence This field needs a comprehensive vision that starts from the theoretical foundation and ends with practical application.

Proper understanding of the scientific method is the key to success

We begin our work with an in-depth understanding of the nature of Studies and its research goals. This understanding is the cornerstone of any analytical process.

We combine Experience practical and theoretical knowledge to ensure a sound methodology. We make sure that every analysis we provide is backed by a deep theoretical understanding.

“The quality of the statistical results reflects the rigor of the methodology, not just the technical prowess”

Careful selection of appropriate statistical tests

We offer Services Careful selection of appropriate tests for the type of data and objectives Search. We consider this aspect to be one of the most important phases of the work.

We use an integrated scientific methodology that starts from understanding the research variables. We ensure the selection of appropriate statistical methods for each research case.

Data type Suitable tests Accuracy level
Metadata Frequencies and percentages High
Quantitative data T-tests and variance Medium to high
Qualitative data K-square tests High

Scientifically sound interpretation of results and hypothesis support

We devote a large part of our work to the scientifically sound interpretation of the results. We ensure that the interpretation is clear and systematically supports the study's hypotheses.

We help Researchers on understanding the significance of statistical results and their practical applications. We emphasize that Accuracy Scientific explanation is what characterizes outstanding research.

We provide a clear explanation of the tests used and the reasons for their selection. We systematically relate the results to the theoretical framework of the study.

We are interested in Data analysis in a way that makes it easy for Researchers Understand and apply them. We believe that clear communication is an essential part of the success of any research project.

Who do we provide specialized statistical analysis to?

We understand the different challenges that researchers face on their scientific journey. So we designed Service Integrated to meet the needs of diverse groups of researchers.

We offer customized solutions for every researcher seeking to excel in Research Scientific. We focus on providing comprehensive support that ensures the success of research projects.

Master's and PhD students looking for rigor

We help graduate students in Preparation Accurate statistical analytics. We focus on accuracy and reliability in every step of the process.

We provide special support for students who are facing technical difficulties. We help them with Application Appropriate statistical methods for their studies.

Academic researchers and faculty

We work with academic researchers in various scientific disciplines. We provide them with advanced solutions that fit the nature of Research complex.

We help with Selection Appropriate statistical methods for each study. We ensure the highest quality of results.

Every researcher needs advanced statistical analysis

We specialize in providing advanced statistical analyses such as SEM and CFA. We use the latest Programs specializing in this field.

We are interested in providing a clear explanation of the results that supports the study's hypotheses. We focus on Design Analytics that support the research in the discussion phase.

Category of researchers Type of service Features of the service
Master's students Basic statistical analysis Full support and interpretation of results
Doctoral students Advanced analysis Advanced statistical modeling
Academic researchers Specialized analysis Systematic support
Faculty members Statistical consultations Customized solutions for research

We offer Test Accurate statistics for each researcher according to their needs. We ensure that the results conform to Saudi academic standards.

We always strive to empower researchers to achieve their scientific goals. We believe that specialized support is key to the success of any research project.

Our advanced tools for statistical analysis

We believe that Tools Sophisticated is the foundation of Acquisition on accurate results. That's why we invest in the latest statistical software to provide you with the best Services.

In OfficeAs a specialist, we use a full suite of statistical software. We ensure that all Tests statistical.

SPSS program: The all-in-one solution for basic and advanced analytics

We rely on SPSS as a comprehensive solution for most types of Research scientific. This program enables us to Procedure Accurate and comprehensive statistical analysis.

We provide integrated descriptive and inferential analytics. We help Clients in understanding the results and applying them to their research.

AMOS program: For structural analysis and equation modeling

We specialize in using AMOS software for advanced structural analysis. This software enables us to build accurate structural equation models.

We use it in CFA. It ensures the accuracy of complex statistical models.

SmartPLS program: For modeling with latent variables

We apply SmartPLS in advanced research with latent variables. This program allows us to build sophisticated statistical models.

We use it especially for research that requires complex analysis. We guarantee accurate and reliable results.

“The quality of statistical tools is directly reflected in the accuracy of research results”

Program type Application area Level of specialization
SPSS Basic and Advanced Analytics Comprehensive
AMOS Structural modeling Advanced
SmartPLS Modeling with latent variables Specialized

We make sure to use the latest versions of these programs. We ensure that Form Advanced and professional for statistical analyses.

We deal professionally with all types of data. We provide integrated statistical solutions that meet the needs of scientific research.

Our professional steps in providing statistical analysis service

We follow a clear scientific methodology that ensures Quality and reliability in every research project. We take care of every detail Work From understanding to final delivery.

We believe that excellence in Writing Statistical reporting needs a plan. That's why we make sure to categorize Work into sequential and deliberate stages.

Accurately understand the research variables and objectives

We begin with an in-depth study of the research plan and objectives. We identify the independent and dependent variables and the nature of the relationship between them.

We care about understanding the research context and hypotheses. This step is essential to ensure Accuracy in the later stages.

Cleaning, coding and organizing data

We check the data for errors. We fix missing values and remove unnecessary duplicates.

We use advanced methods of coding and categorizing data. We ensure that it is easy to Communication With programs Used.

Choosing statistical methods appropriate to the nature of the research

We choose statistical methods based on the nature of the data and the research objectives. We take into account How to The suitability of these methods to the study sample.

We provide a clear explanation of the reasons behind the choice of each method. We ensure that the researcher understands the Work and steps.

Performing analysis using advanced software

We implement analytics using the latest specialized software. We make sure to apply best practices Quality in operation.

We make sure inputs are correct and outputs are accurate. We rely on experience Our team is adept at handling various programs.

Interpret the results and relate them to the hypotheses of the study

Interpret the results in a clear scientific manner and in simple language. We relate them to the study's hypotheses and key research questions.

We are interested in providing practical, actionable recommendations. We take into account Whether The study was academic or applied.

Stage Approximate duration Level of complexity
Understanding the research and its objectives 1-2 days Low
Data cleaning 2-3 days Average
Selection of methods 1-2 days High
Performing the analysis 3-5 days High
Interpretation of results 2-3 days Average

“Excellence in statistical analysis depends not only on software, but also on a deep understanding of scientific methodology”

At each stage, we provide detailed progress reports Work. We ensure full transparency with researchers.

We double-check the results before final delivery. We make sure you adhere to the highest standards of Quality Academy.

Why choose a statistical analysis major?

We offer a unique value proposition that goes beyond just running programs. Our team works with an integrated scientific methodology that ensures the accuracy and reliability of the results.

We believe that Excellence In Scientific research It needs deep practical experience. That's why we are keen to recruit a distinguished cadre of university professors.

Experienced team of experts

We work with an elite group of professors specialized in various fields. Their academic experience spans many years in the field of Statistical analysis.

We don't rely on ordinary software operators. We work with professionals who have a deep understanding of applied statistics.

Adherence to Saudi academic standards

We ensure that all of our analytics meet the standards of Saudi universities. We study each university's requirements meticulously.

We are interested in Results Meet the highest standards of academic quality. We make sure they are defensible in scholarly discussions.

Ensure accurate and error-free results

We apply a double-check system to ensure the work is error-free. We pay attention to detail at every stage of the process Analysis.

We avoid common methodological errors in Statistical analysis. We provide accurate and clear scientific explanations.

Continuous step-by-step follow-up

We provide end-to-end support from the beginning to the end of the project. We stay in constant contact with the researcher during all stages.

We provide accompanying academic consulting for total quality assurance. We take care to explain each step clearly and in detail.

“The quality of statistical analysis reflects the professionalism of the team, not just the accuracy of the programs”

Our advantage How to apply them Benefit to the researcher
Specialized team expertise Specialized university professors Accurate and reliable analysis
Compliance with standards Studying university requirements Academically acceptable results
Accuracy guarantee Double review Error-free
Continuous follow-up Direct connection Reassurance and stability

We use the latest specialized software such as AMOS and SmartPLS. We choose the right program for each Research according to its nature and requirements.

We help you realize Results with the highest quality standards. We guarantee you a successful and hassle-free research journey.

Common challenges we solve for you in statistical analysis

Many face Researchers Methodological obstacles that affect the quality of their scientific results. We provide practical solutions to overcome these difficulties with professionalism.

A professional setting showcasing a diverse group of three analysts collaborating on statistical challenges. In the foreground, a middle-aged Caucasian male analyst, dressed in business attire, is examining a complex graph on a digital tablet. Beside him, a young South Asian female analyst, wearing smart casual clothing, is pointing at a whiteboard filled with colorful charts and notes, illustrating problem-solving methods. In the background, a modern office space with large windows allows natural light to pour in, enhancing the atmosphere of innovation. Soft shadows are cast, and the focus is slightly blurred on the background while maintaining a clear view of the analysts. The overall mood is one of collaboration and determination, emphasizing teamwork in overcoming analytical challenges.

We address the most common issues in Domain Scientific research. We guarantee accurate and reliable results that meet academic standards.

Dealing with insufficient or unreliable data

We use advanced techniques to address issues of missing or unreliable data. We apply special statistical methods to compensate for under-sampling.

We take care to check the quality of the data before starting any analysis. With our extensive experience, we guarantee results that are Accuracy High.

Difficulties cleaning data and handling missing values

We professionally handle the challenges of data cleaning and missing value remediation. We use an integrated scientific methodology that ensures data integrity.

We apply specialized techniques to deal with anomalous and missing values. We take care to maintain the integrity of the original data during processing.

Choosing the wrong statistical methods for the data

We help in selecting statistical methods appropriate to the nature of the data and the objectives of Search. We provide specialized consulting to ensure the appropriateness of statistical tests.

We avoid the common mistake of choosing inappropriate methods. We ensure best practices are applied in this Field.

Misinterpreting results affects conclusions

We prevent misinterpretations of the results that may lead to inaccurate conclusions. We provide a detailed explanation of the results and their statistical significance.

We take care of training Researchers to understand and interpret the results correctly. We ensure that conclusions are clear and fit the hypotheses of Studies.

  • Processing insufficient data with advanced statistical techniques
  • Data cleaning and processing of missing values with a scientific methodology
  • Choosing statistical methods appropriate to the nature of the data
  • Preventing misinterpretations of statistical results
  • Correcting common mistakes in test selection
  • Detailed explanation of the use of statistical tools

We offer Services Integrated to overcome all statistical challenges. We rely on experience Our team in utilizing the latest program statistical.

We guarantee sound statistical analysis, free of common errors. We adhere to the highest standards of academic quality in all our work.

How do you order a specialized statistical analysis service?

Collaborating with our team starts with simple steps that ensure clear expectations and results. We believe that the research journey should be seamless and free of administrative complications.

We provide an integrated system that ensures smooth communication and quality service from the first contact to the delivery of the final results. We take care of every detail of the work to ensure your complete satisfaction.

Steps to contact our specialized team

We offer multiple, direct communication channels for researchers. You can reach out via email, phone, or social media.

We respond to your inquiries within 24 business hours. We provide clear and comprehensive answers to all your questions about Service Statistical analysis.

We take the time to thoroughly understand your research needs before making any offers. We take the time to discuss your Scientific research your own.

Work system and service execution steps

We follow an organized system that ensures quality work and punctuality. The journey of cooperation with us starts with clear steps:

  1. Initial receipt and evaluation of work
  2. Determine the requirements Data analysis Required
  3. Provide a clear and comprehensive quote
  4. Secure checkout
  5. Conduct detailed counseling sessions
  6. Execute Preparation Statistical analysis
  7. Submit the final file with full explanation

We provide a detailed work plan including timeline and implementation details. We ensure complete transparency at every stage of the process.

Quality assurance and timeliness

We adhere to the highest quality standards in all Analysis services which we offer. We apply a double audit system to ensure the accuracy of the results.

We take care to adhere to the delivery dates agreed upon with researchers. We provide regular updates on workflow and progress.

“We believe that timeliness and quality are the foundation of trust in any research collaboration”

We ensure that all analyses adhere to Saudi academic standards. We care about delivering results that can be defended in scientific discussions.

👉 Order Statistical Analysis Service Now start a successful research journey with our specialized team.

Competitive advantages that put us at the forefront of statistical analysis

We have a unique set of advantages that make us the perfect choice for researchers. We offer an integrated package of services that meet the highest quality expectations in the field of scientific research.

A modern office environment showing a diverse group of four professionals engaged in statistical analysis. In the foreground, two men and two women in professional attire are gathered around a sleek, glass conference table filled with data charts and statistical models on laptops. The woman on the left, wearing glasses, is pointing at a digital screen displaying innovative statistical graphs, while the man beside her is taking notes. In the middle ground, a large whiteboard features colorful diagrams illustrating competitive advantages in statistical analysis. The background includes glass partition walls with city skyline views, allowing natural light to fill the space, creating a bright and collaborative atmosphere that conveys innovation and professionalism. The atmosphere is dynamic and focused, highlighting teamwork and expertise in statistical solutions.

We are proud to be the first Arabic platform specialized in this field. We guarantee researchers an exceptional work experience from start to finish.

Accuracy and reliability in the results provided

We strive to deliver 100% accurate results. We implement a double-checking system to ensure error-free work.

We take care of every little detail in the Data analysis. We guarantee the reliability and applicability of the results.

Speed of execution while maintaining quality

We adhere to delivery dates without compromising the quality of the work. We provide fast services that suit the tight schedules of researchers.

We use Programs Advanced technology speeds up the analysis process. We maintain the highest standards of accuracy despite the fast turnaround time.

Competitive prices that suit researchers

We offer affordable rates that fit the budgets of graduate students. We guarantee excellent value for every rial you spend on our services.

We offer flexible payment options to make it easy to do business with us. We are a true investment in the success of Research Scientific.

Ongoing support and accompanying academic counseling

We provide end-to-end support throughout the research journey. We stay with you step by step until you achieve the desired results.

We provide specialized academic consultations during and after the completion of the work. We take care to provide a clear explanation of each stage Application.

“Service quality is not only measured by results, but also by ongoing support and accompanying counseling.”

Competitive advantage How to apply them Benefit to the researcher
Accuracy and reliability Double review and quality check Accurate and reliable results
Speed of execution Using advanced software Meeting deadlines
Competitive prices Various service packages Excellent value for money
Continuous support Accompanying counseling and follow-up Reassurance and confidence
Extensive experience Specialized team with the highest professionalism Guaranteed academic quality

We ensure a personalized follow-up with each researcher until the results are realized. We provide a detailed explanation of the results and the Selection Statistical methods.

We adhere to the academic quality standards adopted by Saudi universities. We provide a guarantee of the results and their defensibility in discussions.

We help you with Design Powerful statistical analytics. We guarantee a successful research journey from start to finish.

Conclusion

We at Science Club Academy offer Services Integrated statistical analysis that helps researchers to Acquisition for accurate results. We use the latest Tools Advanced software to ensure the highest standards of Quality.

We care about every detail Research from data collection to interpretation of results. We offer comprehensive support for graduate students and faculty.

We guarantee to apply Tests statistically significant andProcedure Accurate analytics. We take care of Writing Clear and easy-to-understand reports for all Clients.

We are always looking to help researchers successfully achieve their scientific goals. We are committed to providing statistical solutions that meet the standards of Saudi universities.

Frequently Asked Questions

Q: What services do you offer in the area of statistical analysis?

C: We provide comprehensive services that include data cleaning, selecting appropriate tests, applying analyses using advanced programs such as SPSS and AMOS, and interpreting the results with high scientific accuracy.

Q: How can I contact your team to request a service?

c: You can contact us via email or phone, where we will discuss the requirements of your research and determine the appropriate action plan to achieve the study objectives.

Q: What statistical programs do you use for analysis?

C: We use a range of advanced software such as SPSS for basic analysis, AMOS for structural analysis, and SmartPLS for latent variable modeling to ensure the accuracy of the results.

Q: Do you provide a guarantee that the results are error-free?

A: Yes, we adhere to academic quality standards and ensure that the results are accurate and free of common errors, with continuous follow-up until the desired results are achieved.

Q: What is the duration of the statistical analysis service?

C: The duration varies depending on the size of the data and the complexity of the analysis, but we are keen on speedy execution while maintaining high quality and adhering to delivery dates.

Q: Are your prices suitable for academic researchers and graduate students?

A: Yes, we offer competitive prices that fit the budgets of researchers and master's and doctoral students, while maintaining the quality of the service and the accompanying academic support.